Original Source: http://feedproxy.google.com/~r/tympanus/~3/NVxaS65ELcc/
Making animations that “feel right” can be tricky.
When I’m stuck, I find Disney’s 12 principles of animation useful. They’re from the book ‘The Illusion of Life’ and although the book was written about hand-drawn character animation, a lot of the principles are relevant for animation on the web.
The 7th principle of animation is about arcs:
Most natural action tends to follow an arched trajectory, and animation should adhere to this principle by following implied “arcs” for greater realism.
In other words, animating along a curved path can make movement feel more realistic.
Straight lines are what browsers do best though. When we animate an element from one place to another using a translation the browser doesn’t take realism into account. It’ll always take the fastest and most efficient route.
This is where motion paths can come in handy. Motion paths give us the ability to move an element along a predefined path. They’re great for creating trajectories to animate along.
Use the toggle to see the paths.
See the Pen Alien Abduction- toggle by Cassie Evans (@cassie-codes) on CodePen.default
As well as being useful, they’re quite a lot of fun to play around with.
See the Pen Loop by Cassie Evans (@cassie-codes) on CodePen.default
So, how do you animate along a motion path?
I use GreenSock (GSAP) for most of my SVG animation and I made these demos using the newly released GSAP 3 and their MotionPathPlugin. So, if you want to skip to that bit, go ahead!
Otherwise let’s take a little journey through the past, present and future of motion path animation.
(Did someone say CSS motion paths?)
First, a little setup tip.
Make sure to keep the path and element you’re animating in the same SVG and co-ordinate space, otherwise things get a bit messy.
<svg xmlns=”http://www.w3.org/2000/svg” viewBox=”0 0 1300 800″>
<path class=”path” d=”M1345.7 2.6l2.4-4.4″/>
<g class=”rocket”>
…
</g>
</svg>
SMIL
If you google “SVG motion path animation”, you’re going to get a lot of hits talking about SMIL.
SMIL was the original proposed method for SVG animation. It included the ability to animate along a path using the <animatemotion> element.
It’s nice and declarative and currently the browser support is surprisingly good, covering all modern browsers except Edge and Opera Mini.
But, and this is a big but, the future of SMIL is uncertain, and has been for a while.
It was deprecated by Chrome a few years back and although they’ve now suspended that deprecation, implementations still vary and there’s no clear path towards cross-browser support.
Although it’s fun to play around with, SMIL isn’t very future-proof, so I’m only going to touch on it.
In order to animate along a path with the animateMotion element, you reference the path you want to animate along using path=”…” and define the element you want to animate using xlink:href=”#…”:
<animateMotion
path=”M20.2…”
xlink:href=”#rocket”
dur=”10s”
rotate=”auto”
/>
See the Pen loop SMIL by Cassie Evans (@cassie-codes) on CodePen.default
With SMIL effectively out of the picture, browser vendors are now focused on supporting modern alternatives like the CSS Motion Path Module.
CSS Motion Path Module
Attention: As of the time of writing, the examples in this section are experimental and best viewed in Chrome.
You can check out which features your browser supports in the demo below.
See the Pen Browser Support – CSS motion path module by Cassie Evans (@cassie-codes) on CodePen.default
If you’ve got all green smiley faces, you’re good to go. But you may have a sad face for offset-anchor. This is because this property is currently still experimental. It’s behind a flag in Chrome, meaning it’s not turned on by default.
You can choose to enable it by going to this URL in Chrome:
chrome://flags/#enable-experimental-web-platform-features
and enabling experimental web platform features.

This module is joint work by the SVG and CSS working groups, so unlike SMIL, we’ll be able to use CSS motion paths to animate both, HTML and SVG DOM elements. I love a CSS-only solution, so although it’s not ready to use in production (yet), this is pretty exciting stuff.
The motion path module consists of five properties:
offset (shorthand property for the following)
offset-path
offset-distance
offset-anchor
offset-rotate
offset-path
offset-path defines the path that we can place our element on. There are a few proposed values but path() seems to be the only one supported right now.
.rocket {
offset-path: path(‘M1345.7 2.6l2.4-4.4’);
}
path() takes a path string with SVG coordinate syntax, which may look scary, but you don’t have to write this out. You can create a path in a graphics editing program and copy and paste it in.
offset-distance
offset-distance specifies the position along an offset-path for an element to be placed. This can be either in pixels or as a percentage of the length of the path.
See the Pen Rocket – CSS motion path – offset-distance by Cassie Evans (@cassie-codes) on CodePen.default
offset-anchor
By default the element’s top left corner will be aligned with the path, but we can change this with offset-anchor.
offset-anchor behaves a lot like transform-origin. In fact if set to auto, it’s given the same value as the element’s transform-origin, so we can optionally use transform-origin for the same results.
Like transform-origin it accepts a position with x and y values, either as a percentage or a keyword like bottom or left.
Have a play with the values:
See the Pen Rocket – CSS motion path – offset anchor by Cassie Evans (@cassie-codes) on CodePen.default
offset-rotate
offset-rotate defines the direction the element faces on the path.
By default it’s set to auto and will rotate with the path. You can pass in an optional second value in degrees in order to tweak the direction of this rotation.
See the Pen Rocket – CSS motion path – offset-rotate – auto deg by Cassie Evans (@cassie-codes) on CodePen.default
If you want your element to face the same direction throughout, and not rotate with the path, you can leave out auto and pass in a value in degrees.
See the Pen Rocket – CSS motion path – offset-rotate – deg by Cassie Evans (@cassie-codes) on CodePen.default
These properties were renamed from motion to offset since this spec was proposed. This is because alone, these properties just provide another way to set the position and rotation of absolutely positioned elements. But we can create motion by using them in conjunction with CSS animations and transitions.
.rocket {
offset-path: path(‘M20.2…’);
offset-anchor: 50% 50%;
offset-rotate: auto;
/* if offset anchor isn’t supported we can use transform-origin instead */
transform-origin: 50% 50%;
animation: move 8s forwards linear;
transform-box: fill-box;
}
@keyframes move {
from {
offset-distance: 0%;
}
to {
offset-distance: 100%;
}
}
See the Pen Rocket – CSS motion path by Cassie Evans (@cassie-codes) on CodePen.default
Attention: SVG transform-origin quirks.
In this demo, I’m using a relatively new CSS property, transform-box.
This is to avoid a browser quirk that’s caught me out a few times. When calculating transforms and transform-origin, some browsers use the element’s bounding box as the reference box and others use the SVG viewbox.
If you set the value to fill-box the objects bounding box is used as the reference box.
And if you set the value to view-box the nearest SVG viewbox is used as the reference box.
You can see what happens to the center of rotation when we change it here:
See the Pen Rocket – CSS motion path – transform-box by Cassie Evans (@cassie-codes) on CodePen.default
GreenSock Animation Platform (GSAP)
While we wait for the CSS solution to be more widely implemented we’re in a bit of a motion path limbo. Thankfully there’s some JavaScript animation libraries that are bridging this gap.
I usually use GreenSock for SVG animation for a few reasons.
There are some cross browser quirks with SVG, especially with how transforms are handled. The folks at GreenSock go above and beyond to handle these inconsistencies.
Animation can also be a bit fiddly, especially when it comes to fine-tuning timings and chaining different animations together. GreenSock gives you a lot of control and makes creating complex animations fun.
They also provide some plugins that are great for SVG animation like DrawSVG, MorphSVG and MotionPathPlugin.
They’re all free to experiment with on Codepen, but some of the plugins are behind a membership fee. MotionPathPlugin is one of the free ones, and part of the new GSAP 3 release.
MotionPathPlugin gives you the ability to turn an SVG path into a motion path, or specify your own path manually. You can then animate SVG or DOM elements along that path, even if those elements are in a completely different coordinate space.
Here’s a demo with the necessary libraries added to start you off.
In order to use a plugin we have to register it, like this:
gsap.registerPlugin(MotionPathPlugin);
Then we can start animating. This is what a tween using the simplified GSAP 3 syntax looks like:
gsap.to(“.rocket”, {
motionPath: …
duration: 5,
});
The name ‘tween’ comes from the world of hand-drawn animation, too.
Tweening is the process of generating intermediate frames between two images to give the appearance that the first image evolves smoothly into the second image.
That’s pretty much what a GSAP tween does. You feed in the element you want to animate, the duration, and the properties you want to target and the tween will figure out the in-between states.
The motionPath attribute can be used shorthand, and passed a path:
gsap.to(“.rocket”, {
motionPath: “#path”,
duration: 5,
});
Or, if we want more control over the settings we can pass it an object of options:
gsap.to(“.rocket”, {
motionPath: {
path: “#path”,
align: “#path”,
autoRotate: true,
},
duration: 5,
});
See the Pen Rocket – GSAP motion path by Cassie Evans (@cassie-codes) on CodePen.default
Here are some of the properties we can control.
path
This defines the motion path we’re animating along, we can reference a path that exists in the document by using a selector,
motionPath: {
path: “#path”,
}
a string that contains SVG path data,
motionPath: {
path: ‘M125.7 655a9.4 9.4…’,
}
an object containing an array of x and y co-ordinates to move between,
motionPath: {
path: [{x: 100, y: 100}, {x: 300, y: 20}]
}
or a variable referring to one of these options:
const myPath = ‘M125.7 655a9.4 9.4…’
motionPath: {
path: myPath,
}
align
We can use this to align the element to the path, or other elements in the document by passing in a selector:
motionPath: {
path: “#path”,
align: “#path”
}
We can also align the element to itself if we want the animation to start from the element’s current position.
motionPath: {
path: “#path”,
align: “self”
}
In the next demo, the purple rocket is aligned to self and the green rocket is aligned to the path.
align: “self” is like moving the path to the element, rather than the element to the path.
See the Pen Rocket – GSAP motion path – align by Cassie Evans (@cassie-codes) on CodePen.default
By default, the element’s top left corner will be the center of rotation and alignment. In order to align the element accurately on the path you’ll need to set the element’s center of rotation, like this:
gsap.set(“.rocket”, {
xPercent: -50,
yPercent: -50,
transformOrigin: “50% 50%”
});
autoRotate
This is how we get our element to rotate along with the curvature of the path:
motionPath: {
path: “#path”,
align: “#path”
autoRotate: true,
}
We can also provide a number value. This will rotate along with the path, but maintain that angle relative to the path.
motionPath: {
path: “#path”,
align: “#path”
autoRotate: 90,
}
start & end
These properties let us define where on the path the motion should begin and end.
By default, it starts at 0 and ends at 1, but we can provide any decimal number:
motionPath: {
path: “#path”,
align: “#path”
autoRotate: true,
start: 0.25,
end: 0.75,
}
If you want the element to go backwards along the path, you can provide negative numbers.
See the Pen Rocket – GSAP motion path – align by Cassie Evans (@cassie-codes) on CodePen.default
immediateRender
If your element is starting off at a different position in the document and you want it to align with the path you might notice a jump as it moves from its position to the path.
See the Pen Rocket – GSAP motion path – align by Cassie Evans (@cassie-codes) on CodePen.default
You can fix force it to render immediately upon instantiation by adding immediateRender:true to the tween.
// animate the rocket along the path
gsap.to(“.rocket”, {
motionPath: {
path: “#path”,
align: “#path”,
autoRotate: true,
},
duration: 5,
ease: “power1.inOut”,
immediateRender: true,
});
MotionPathHelper
Another super cool feature of the GSAP 3 release is the MotionPathHelper.
It enables you to edit paths directly in the browser! I found this really helpful, as I’m always going back and forth between the browser and my graphics editor.
Give it a go in the demo below. When you’re done, click “copy motion path” to copy the SVG path data to your clipboard. Paste the new path data into the d=”” attribute in the SVG code to update your path.
There are instructions on how to edit the path in the GSAP docs.
See the Pen Rocket – GSAP motion path – helper by Cassie Evans (@cassie-codes) on CodePen.default
GreenSock is a ton of fun to play around with!
There are a bunch of other features and plugins that when paired with motion path animation can be used to create really cool effects.
In this demo, DrawSVG is progressively showing the text path as some staggered elements animate along the path using MotionPathPlugin:
See the Pen Squiggle text animation by Cassie Evans (@cassie-codes) on CodePen.default
If you’ve had fun with these examples and want to explore GreenSock some more, Christina Gorton has written The New Features of GSAP 3 providing a practical overview.
GreenSock also have a great getting started guide.
Happy animating!
Motion Paths – Past, Present and Future was written by Cassie Evans and published on Codrops.




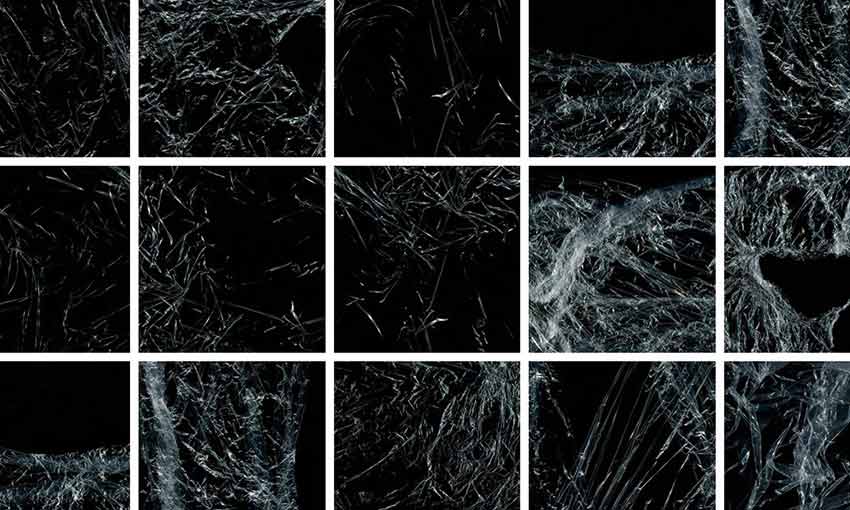





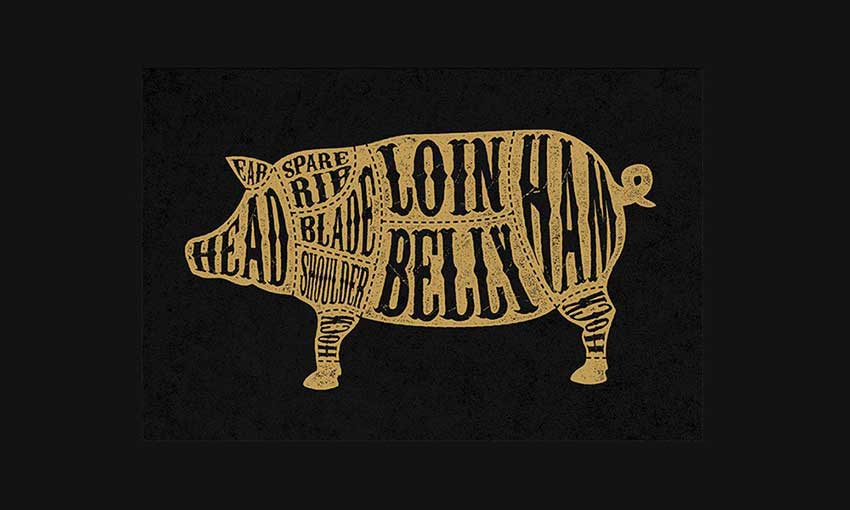


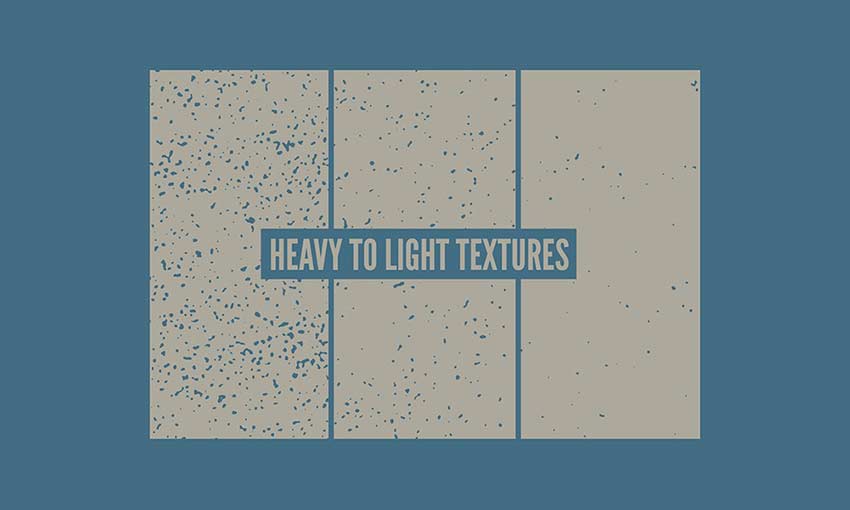

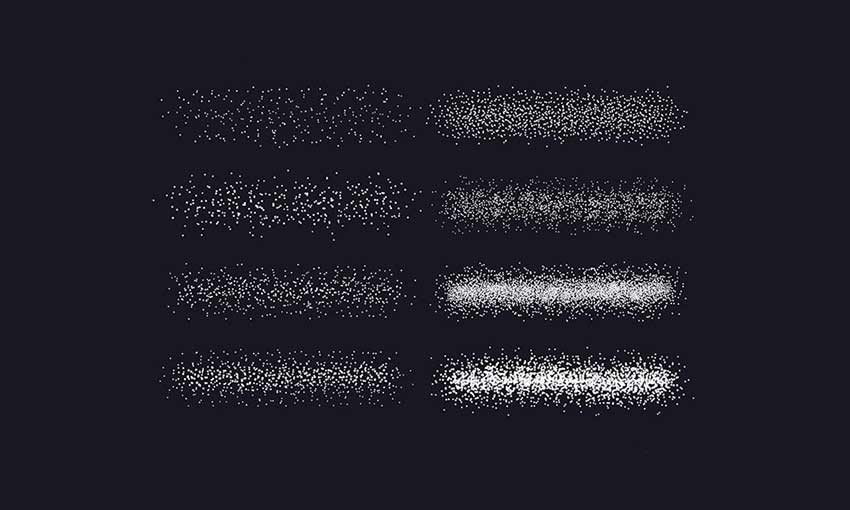



 This month’s collection of design trends is a gift to behold. Each of the trends are highly usable options that are versatile, giving you plenty of room to play and make them your own. That’s the best kind of trend, right?




 It’s that time of the year again. If you skipped Black Friday there’s still Cyber Monday.

