20 Progress Bar UI (Freebies) to Download

Original Source: https://www.hongkiat.com/blog/progress-bar-freebies/

For today’s internet user, even an eye blink is too long to wait. However, there are some websites (especially the media-heavy ones) that take some time to load. So to cope with an impatient…

Visit hongkiat.com for full content.

Data Visualization With ApexCharts

Original Source: https://smashingmagazine.com/2020/11/data-visualization-apexcharts/

ApexCharts is a modern charting library that helps developers to create beautiful and interactive visualizations for web pages with a simple API, while React-ApexCharts is ApexChart’s React integration that allows us to use ApexCharts in our applications. This article will be beneficial to those who need to show complex graphical data to their customers.

Getting Started

First, install the React-ApexCharts component in your React application and import react-apexcharts.

npm i react-apexcharts apexcharts

import ReactApexCharts from ‘react-apexcharts’

The core components of an ApexChart is its configuration object. In the configuration object, we define the series and options properties for a chart. series is the data we want to visualize on the chart. In the series, we define the data and name of the data. The values in the data array will be plotted on the y-axis of the chart. The name of the data will appear when you hover over the chart. You can have a single or multiple data series. In options, we define how we want a chart to look, the features and tools we want to add to a chart and the labels of the x and y axes of a chart. The data we define in the configuration object’s series and options properties is what we then pass to the ReactApexChart component’s series and options props respectively.

Here is a sample of how the components of an ApexChart work together. (We will take a closer look at them later in the article.)

const config = {
series: [1, 2, 3, 4, 5],
options: {
chart: {
toolbar: {
show: true
},
}
}
}

return (
<ReactApexChart options={config.options} series={config.series} type=”polarArea” />
)

When going through the docs, you will notice that the width, height, and type of chart are defined in the options object, like in the code snippet below.

const config = {
series: [44, 55, 13, 43, 22],
chart: {
width: 380,
type: ‘pie’
}
},

This is because the docs were written with vanilla JavaScript application in mind. We are working with React, so we define the width, height, and type by passing them in as props to the ReactApexCharts component. We will see how this works in the next section.

Line Charts

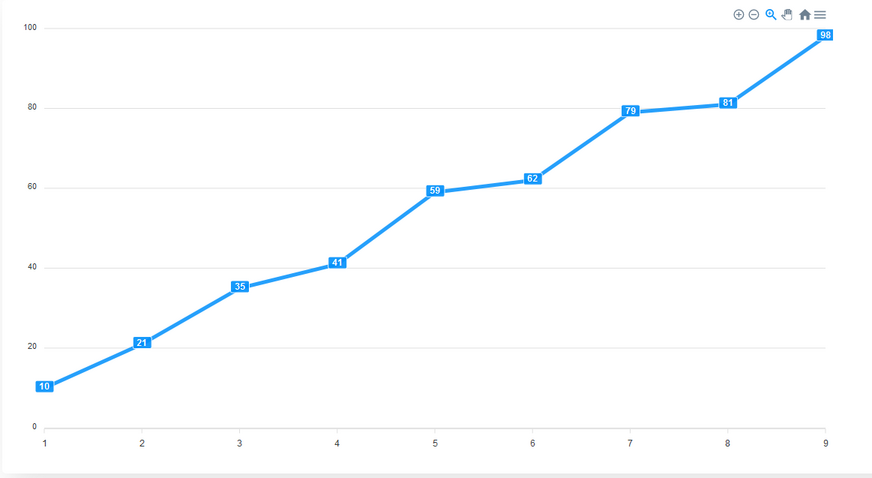
This is a type of chart used to show information that changes over time. We plot a line using several points connected by straight lines. We use Line charts to visualize how a piece of data changes over time. For example, in a financial application, you could use it to show a user how their purchases have increased over some time.
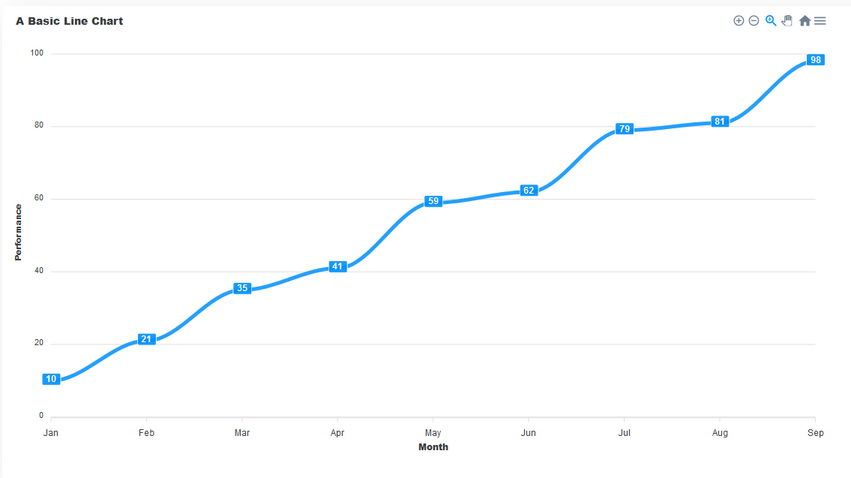
This chart consists of the following components:

Title
This sits on top of the chart and informs the user about what data the chart represents.
Toolbar
The toolbar is at the right-hand corner in the image above. It controls the level of zoom of the chart. You can also export the char through the toolbar.
Axis labels
On the left and right axes, we have the labels for each axis.
Data labels
The data labels are visible at each plot point on the line. They make it easier to view the data on the chart.

We have seen how a line chart looks and its different components. Now let us go through the steps of building one.

We start with series. Here we define the data of the series and its name. Then, we pass the options and series to the ReactApexChart component’s props. We also define the type of chart in the type prop and set it to line.

const config = {
series: [{
name: “Performance”,
data: [10, 21, 35, 41, 59, 62, 79, 81, 98]
}],
options: {}
}
return (
<ReactApexChart options={config.options} series={config.series} type=”line” />
)

The critical part of an ApexChart is its series data. The configurations defined in the options property are optional. Without setting any definitions in options, the data will still be displayed. However, it may not be the most readable chart. If you decide not to set any custom definitions in options, it must still be present as an empty object.
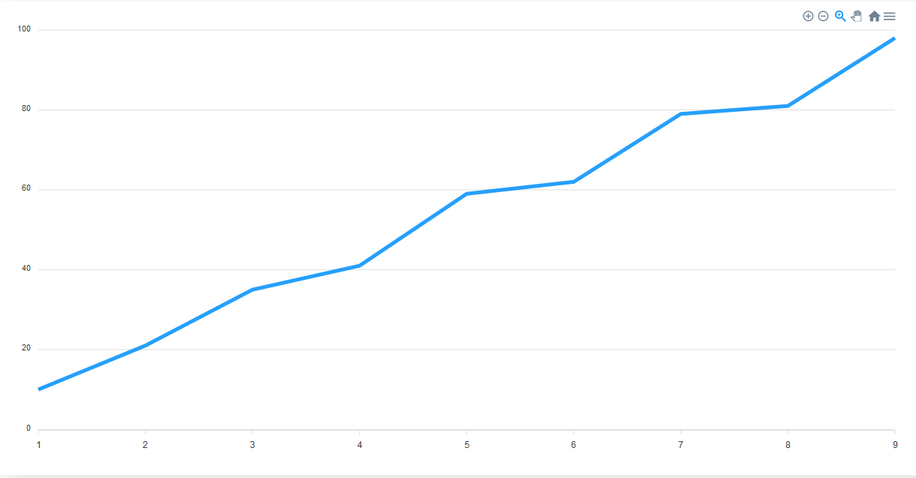
Let’s configure the options of the chart by adding some values to the options object we have in the config object.

In the chart property of the options object, we define the configurations of the chart. Here, we add the toolbar from the chart by setting its show property to true. The toolbar provides us with tools to control the zoom level of the chart and to export the chart in different file formats. The toolbar is visible by default.

options: {
chart: {
toolbar: {
show: true
},
},
}

We can make our chart easier to read by enabling data labels for the chart. To do that, we add the dataLabels property to the options object and set it’s enabled property to true. This makes it easier to interpret the data in the chart.

dataLabels: {
enabled: true
},
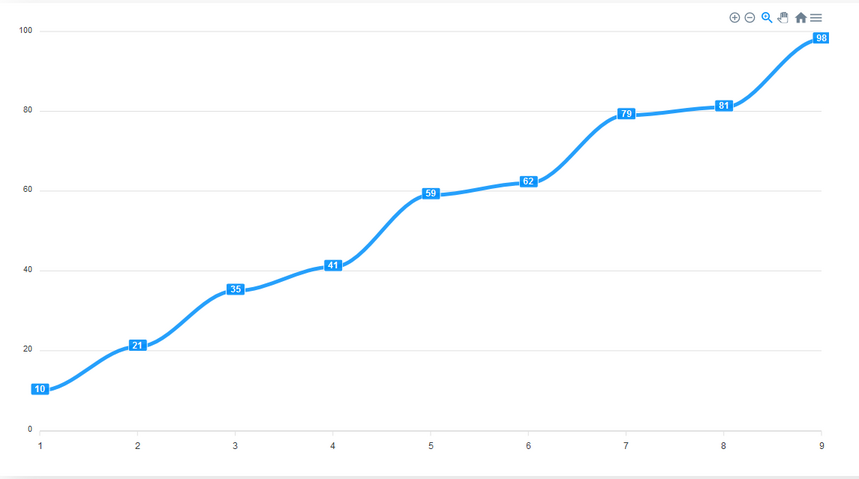
By default, the stroke of a line chart is straight. However, we can make it curved. We add the stroke property to options and set to it’s curve to smooth.

stroke: {
curve: “smooth”
}
An important part of any chart is its title. We add a title property to options to give the chart a title.

title: {
text: ‘A Line Chart’,
align: ‘left’
},

We can add labels to the x and y axes of the chart. To do this we add xaxis and yaxis properties to options and there, we define the title for each axis.

xaxis: {
categories: [‘Jan’, ‘Feb’, ‘Mar’, ‘Apr’, ‘May’, ‘Jun’, ‘Jul’, ‘Aug’, ‘Sep’],
title: {
text: ‘Month’
}
},
yaxis: {
title: {
text: ‘Performance’
}
}

In the end, your code should look like this. With these steps, we’ve not only built a line chart but seen a breakdown of how the options we define can enhance a chart.

import ReactApexCharts from ‘react-ApexCharts’

const config = {
series: [{
name: “Performance”,
data: [10, 21, 35, 41, 59, 62, 79, 81, 98]
}],
options: {
chart: {
toolbar: {
show: true
},
},

dataLabels: {
enabled: true
},
stroke: {
curve: “smooth”
}

title: {
text: ‘A Line Chart’,
align: ‘left’
},
xaxis: {
categories: [‘Jan’, ‘Feb’, ‘Mar’, ‘Apr’, ‘May’, ‘Jun’, ‘Jul’, ‘Aug’, ‘Sep’],
title: {
text: ‘Month’
}
},

yaxis: {
title: {
text: ‘Performance’
}
}
}
}
return (
<ReactApexChart options={config.options} series={config.series} type=”line” />
)

Area Charts

An area chart is like a line chart in terms of how data values are plotted on the chart and connected using line segments. The only difference is that in an area chart, the area plotted by the data points is filled with shades or colors. Like line charts, area charts depict how a piece of data changes over time. However, unlike line charts, they can also visually represent volume. We can use it to show how groups in a series of data intersect. For example, a chart that shows you the volume of users that access your application through different browsers.
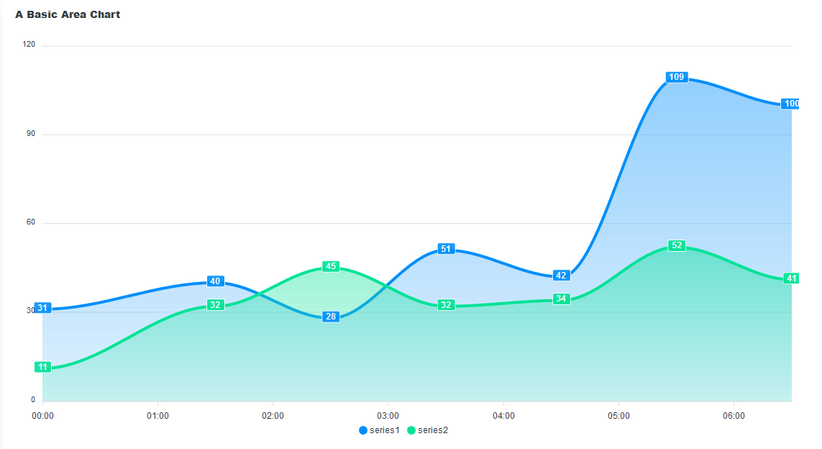
In the image above, we have an example of an area chart. Like the line chart, it has a title, data labels, and axis labels. The shaded portion of the plotted area chart shows the volume in the data. It also shows how the data in series1 intersects with that of series2. Another use case of area charts is in showing the relationship between two or more pieces of data and how they intersect.

Let’s see how to build a stacked area chart and how to add data labels to it.

To make an area chart, we set the chart type to area and the stroke to smooth. This is the default stroke for an area chart.

const config = {
options: {
stroke: {
curve: ‘smooth’
}
}
}

return (
<ReactApexChart options={config.options} series={config.series} type=”area” />
)

To make it a stacked chart, in the chart property of the options object, we set stacked to true.

const config = {
options: {
stroke: {
curve: ‘smooth’
},
chart: {
stacked: true
}
}

return (
<ReactApexChart options={config.options} series={config.series} type=”area” />
)

Bar Charts

We use bar charts to presents data with rectangular bars at heights or lengths proportional to the values they represent. It is best used to compare different categories, like what type of car people have or how many customers a shop has on different days.
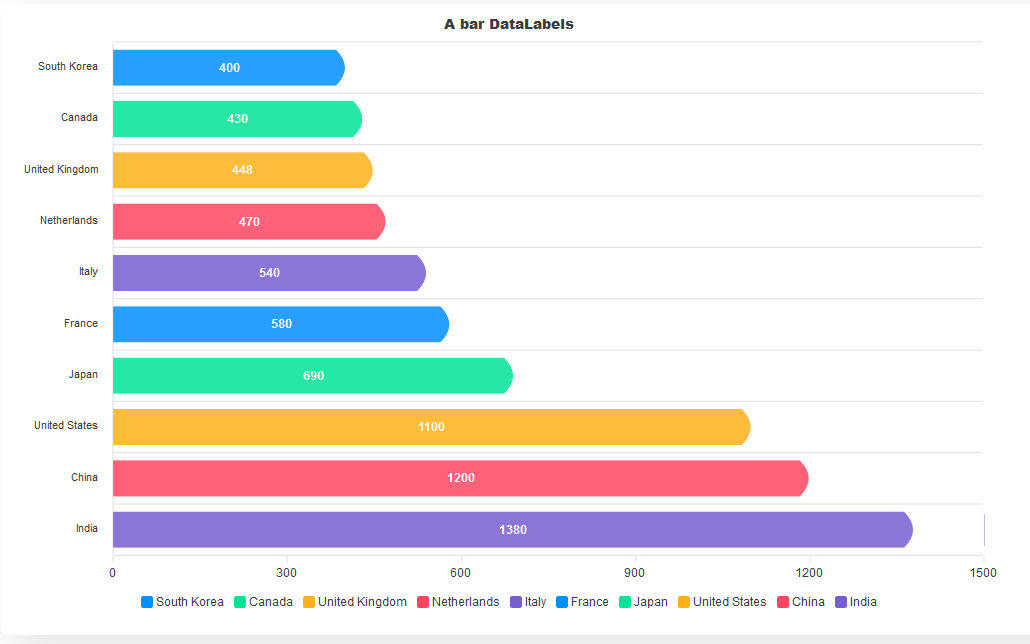
The horizontal bars are the major components of a bar chart. They allow us to easily compare values of different categories with ease.

In building a bar chart, we start by defining the series data for the chart and setting the ReactApexChart component’s type to bar.

const config = {
series: [{
data: [400, 430, 448, 470, 540, 580, 690, 1100, 1200, 1380]
}],
options: {}
}
return (
<ReactApexChart options={config.options} series={config.series} type=”bar” />
)
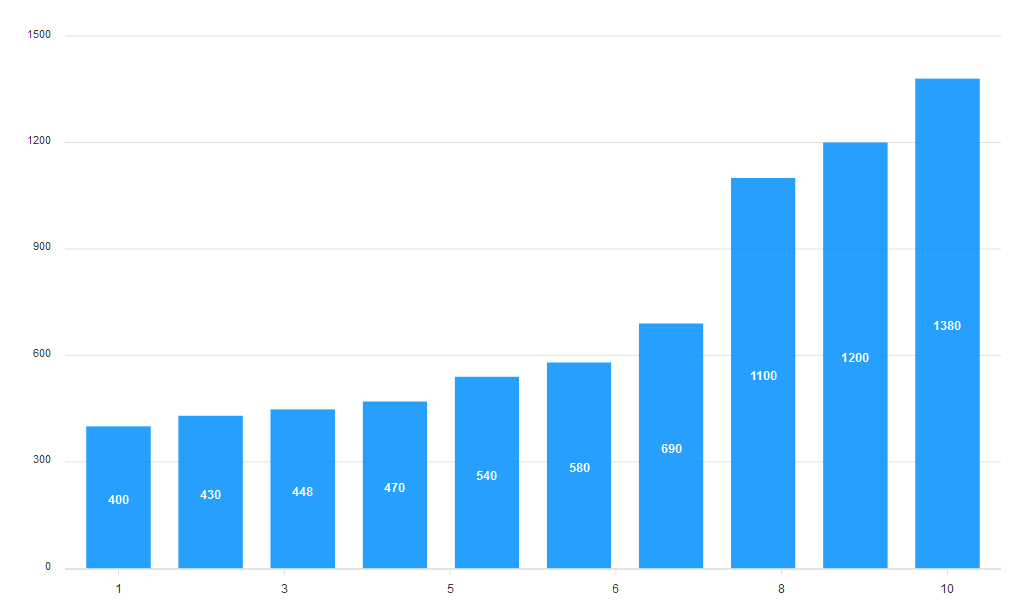
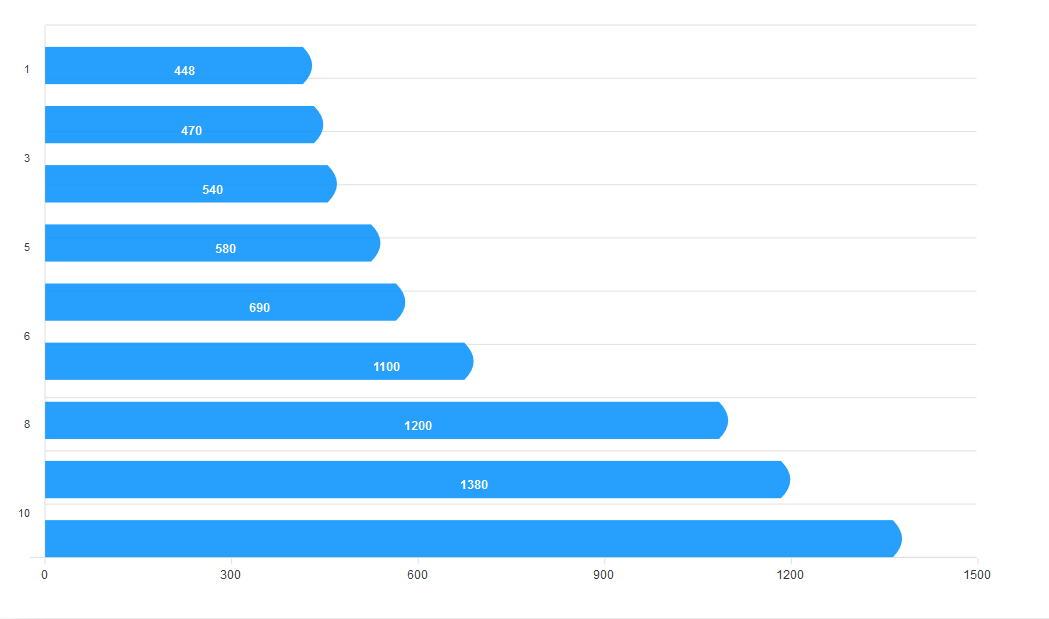
Let’s add more life and distinction to the bars. By default, bar charts are vertical. To make them horizontal, we define how we want the bars to look in the plotOptions property. We set the horizontal prop to true to make the bars horizontal. We set the position of the dataLabels to bottom. We can also set it to top or center. The distributed prop adds distinction to our bars. Without it, no distinct colors will be applied to the bars, and the legend will not show at the bottom of the chart. We also define the shape of the bars using the startingShape and endingShape properties.

options{
plotOptions: {
bar: {
distributed: true,
horizontal: true,
startingShape: “flat”,
endingShape: “rounded”,
dataLabels: {
position: ‘bottom’,
},
}
},
}
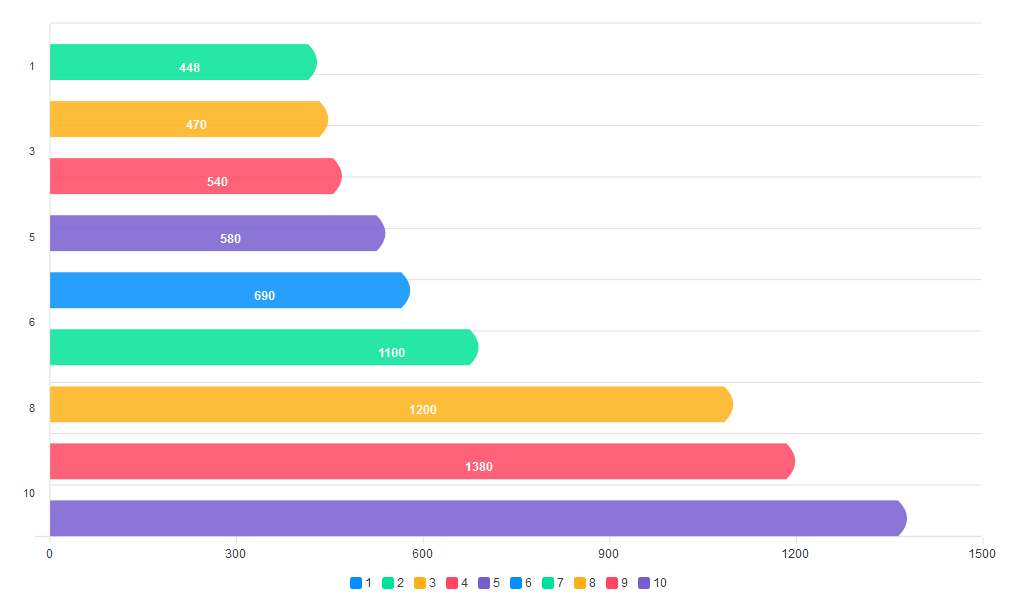
Next, we add the categories, labels, and titles to the chart.

xaxis: {
categories: [‘South Korea’, ‘Canada’, ‘United Kingdom’, ‘Netherlands’, ‘Italy’, ‘France’, ‘Japan’, ‘United States’, ‘China’, ‘India’]
},

title: {
text: ‘A bar Chart’,
align: ‘center’,
},

Column Charts

A column chart is a data visualization where each category is represented by a rectangle, with the height of the rectangle being proportional to the plotted values. Like bar charts, column charts are used to compare different categories of data. Column charts are also known as vertical bar charts. To convert the bar chart above to a column chart, all we have to do is set horizontal to false in the plotOptions.
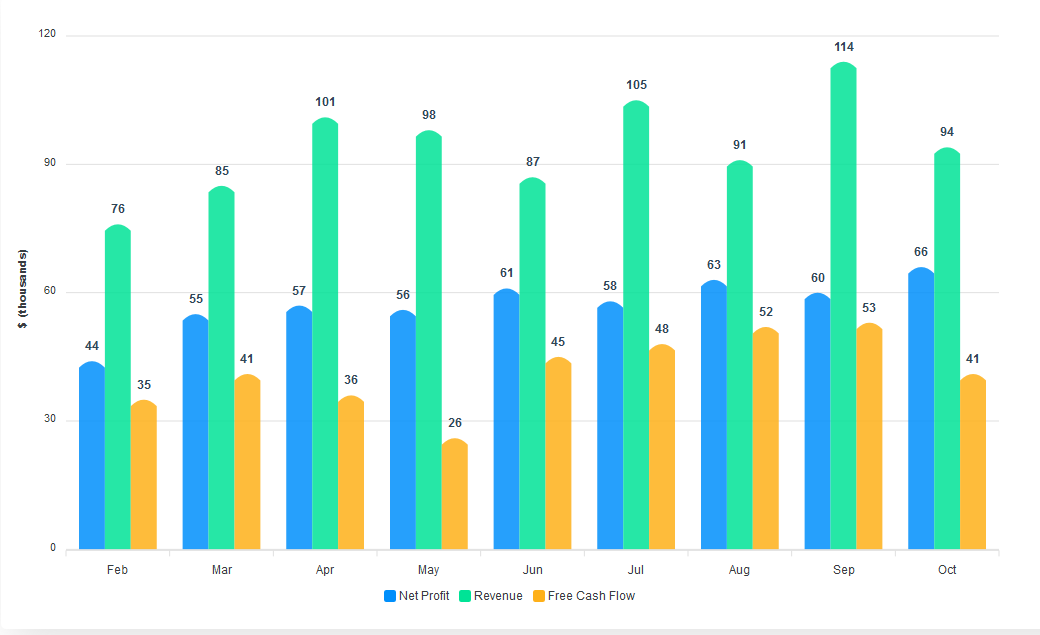
The vertical columns make it easy to interpret the data we visualize. Also, the data labels added to the top of each column increase the readability of the chart.

Let’s look into building a basic column chart and see how we can convert it to a stacked column chart.

As always, we start with the series data and setting the chart type to “bar”.

const config = {
series: [{
name: ‘Net Profit’,
data: [44, 55, 57, 56, 61, 58, 63, 60, 66]
}, {
name: ‘Revenue’,
data: [76, 85, 101, 98, 87, 105, 91, 114, 94]
}, {
name: ‘Free Cash Flow’,
data: [35, 41, 36, 26, 45, 48, 52, 53, 41]
}],
options: {}
}

return (
<ReactApexChart options={config.options} series={config.series} type=”bar” />
)
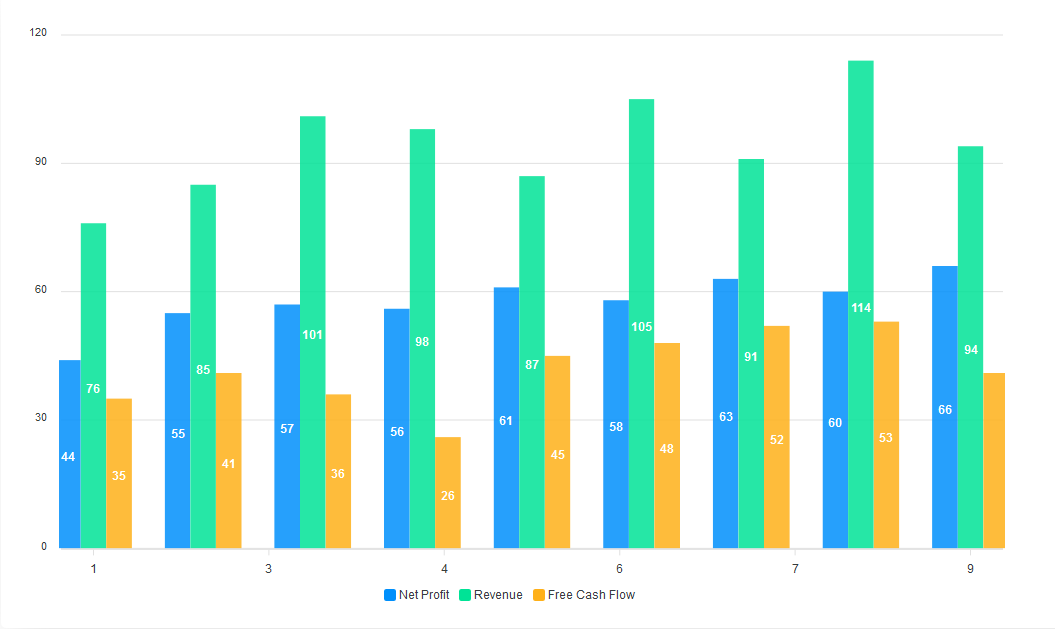
This is what we get out of the box. However, we can customize it. We define the width and shape of the bars in the plotOptions property. We also set the position of the dataLabel to top.

options: {
plotOptions: {
bar: {
columnWidth: ‘75%’,
endingShape: ‘flat’,
dataLabels: {
position: “top”
},
},
},
}
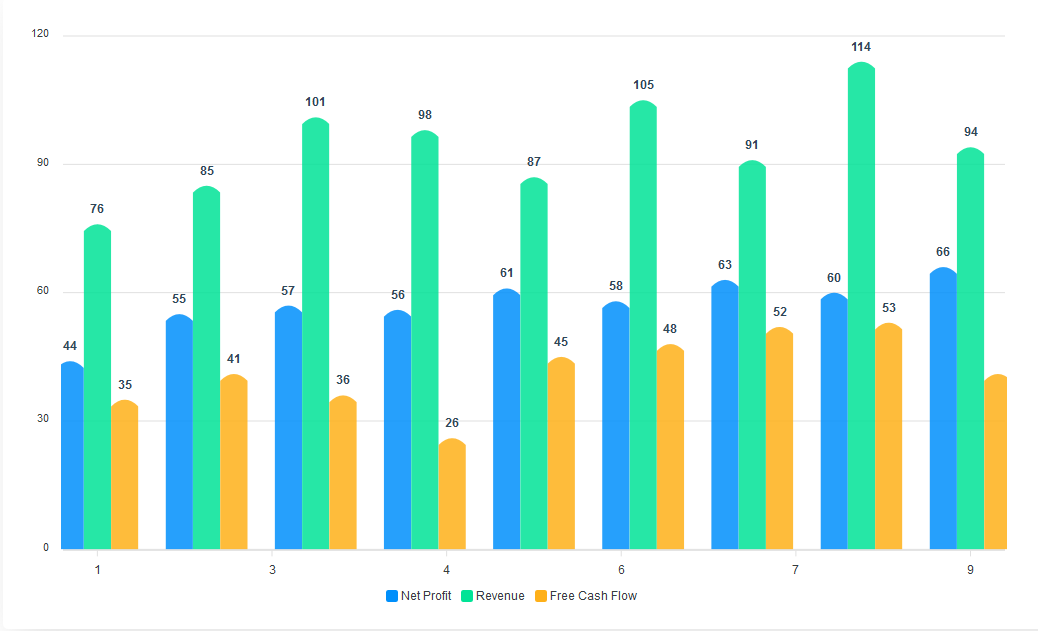
Next, we define the style and font-size of the data labels and their distance from the graphs. Finally, we add the labels for the x and y axes.

options: {
dataLabels: {
offsetY: -25,
style: {
fontSize: ’12px’,
colors: [“#304758”]
}
},

xaxis: {
categories: [‘Feb’, ‘Mar’, ‘Apr’, ‘May’, ‘Jun’, ‘Jul’, ‘Aug’, ‘Sep’, ‘Oct’],
},

yaxis: {
title: {
text: ‘$ (thousands)’
}
},
}

To convert this to a stacked chart, all we have to do is add a stacked property to the chart and set it to true. Also, since we switched to a stacked chart, we’ll change the endingShape of the bars to flat to remove the curves.

options: {
chart: {
stacked: true,
},

plotOptions: {
bar: {
endingShape: ‘flat’,
}
}
}

Pie And Donut Charts

A pie chart is a circular graph that shows individual categories as slices – or percentages – of the whole. The donut chart is a variant of the pie chart, with a hole in its center, and it displays categories as arcs rather than slices. Both make part-to-whole relationships easy to grasp at a glance. Pie charts and donut charts are commonly used to visualize election and census results, revenue by product or division, recycling data, survey responses, budget breakdowns, educational statistics, spending plans, or population segmentation.

In pie and donut charts, series is calculated in percentages. This means the sum of the values in the series should be 100.

Let’s start by building a pie chart. We set the chart type to pie. We also define the series for the chart and define the labels in the options. The order of the labels corresponds with the values in the series array.

const config = {
series: [20, 10, 35, 12, 23],
options: {
labels: [‘Team A’, ‘Team B’, ‘Team C’, ‘Team D’, ‘Team E’],
}
}

return (
<ReactApexChart options={config.options} series={config.series} type=”pie” />
)

We can control the responsive nature of our charts. To do this, we add a responsive property to the chart’s options. Here we set the max-width breakpoint to 480px. Then, we set the width of the chart to 450px and the position of the legend to bottom. Now, at screen sizes of 480px and below, the legend will appear at the bottom of the chart.

options: {
labels: [‘Team A’, ‘Team B’, ‘Team C’, ‘Team D’, ‘Team E’],
responsive: [{
breakpoint: 480,
options: {
chart: {
width: 450
},
legend: {
position: ‘bottom’
}
}
}]
},

To convert the pie chart to a donut chart, all you have to do is change the component’s type to donut.

<ReactApexChart options={config.options} series={config.series} type=”donut” />

Mixed Charts

Mixed charts allow you to combine two or more chart types into a single chart. You can use mixed charts when the numbers in your data vary widely from data series to data series or when you have mixed type of data (for example, price and volume). Mixed charts make it easy to visualize different data types in the same format simultaneously.
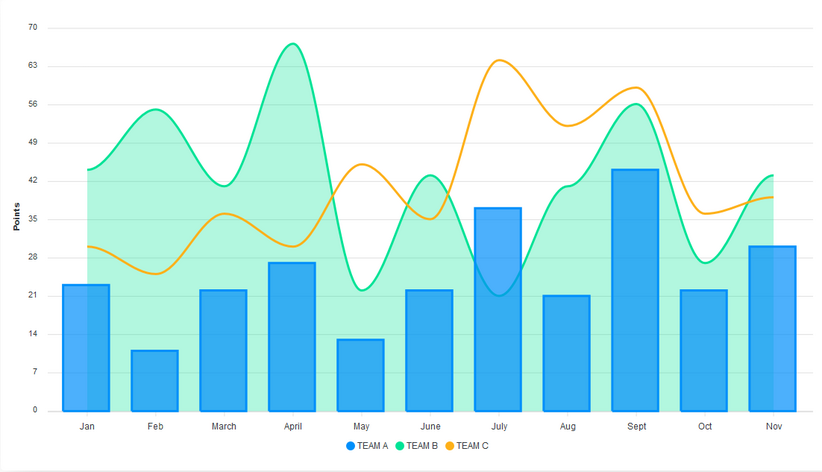
Let’s make a combination of a line, area, and column chart.

We define the series data and the type for each of the charts. For mixed charts, the type of each chart is defined in its series, and not in the ReactApexChart component’s type prop.

const config = {
series: [{
name: ‘TEAM A’,
type: ‘column’,
data: [23, 11, 22, 27, 13, 22, 37, 21, 44, 22, 30]
}, {
name: ‘TEAM B’,
type: ‘area’,
data: [44, 55, 41, 67, 22, 43, 21, 41, 56, 27, 43]
}, {
name: ‘TEAM C’,
type: ‘line’,
data: [30, 25, 36, 30, 45, 35, 64, 52, 59, 36, 39]
}],
options: {}
}
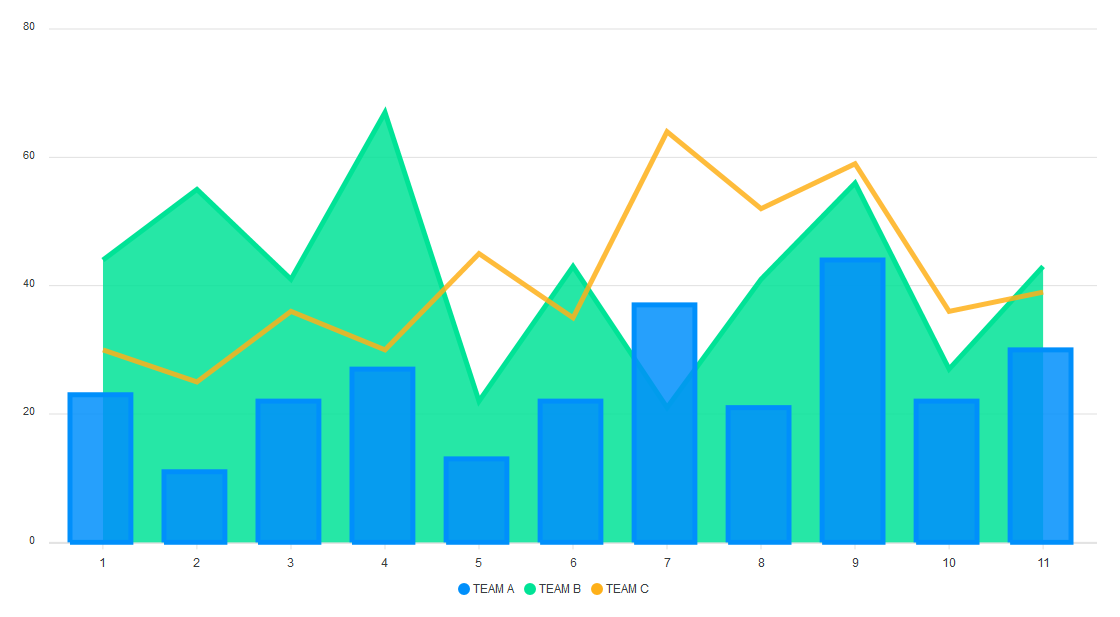
Next, we set the stroke type to smooth and define its width. We pass in an array of values to define the width of each chart. The values in the array correspond to the order of the charts defined in series. We also define the opacity of each chart’s fill. For this, we also pass in an array. This way, we can control the opacity of each chart separately.

Lastly, we add the labels for the x and y axes.

options: {
stroke: {
width: [2,2,4],
curve: ‘smooth’
},
fill: {
opacity: [0.7, 0.3, 1],
},
labels: [‘Jan’, ‘Feb’, ‘March’, ‘April’, ‘May’, ‘June’, ‘July’,
‘Aug’, ‘Sept’, ‘Oct’, ‘Nov’],
yaxis: {
title: {
text: ‘Points’,
},
},
}

Customizing our charts

Apart from changing the color of our charts, we can add some level of customization to them.

We can add grids to our charts and style them. In the grid property, we define the colors for the rows and columns of the chart. Adding grids to your chart can make it easier to understand.

options: {
grid: {
row: {
colors: [‘#f3f3’, ‘transparent’],
opacity: 0.5
},
column: {
colors: [‘#dddddd’, ‘transparent’],
opacity: 0.5
},
},
}
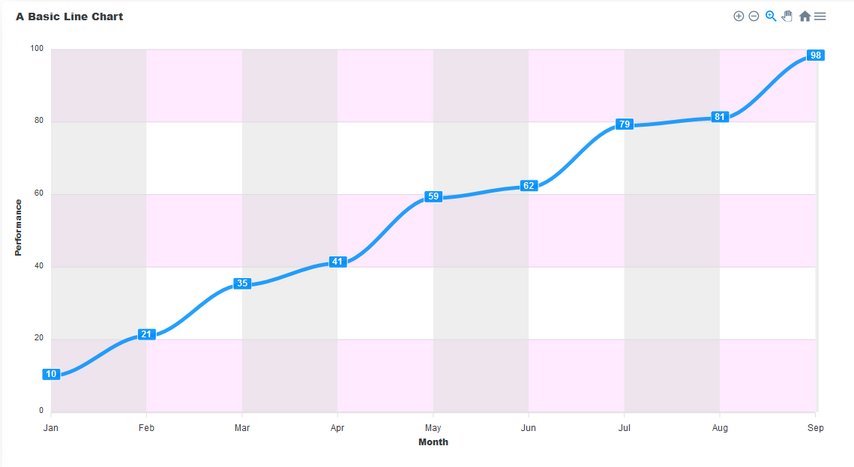
We can adjust the stroke of the charts and define their colors. Let’s do that with the column chart. Each color in the colors array corresponds with the data in the series array.

options: {
stroke: {
show: true,
width: 4,
colors: [‘red’, “blue”, “green” ]
},
}
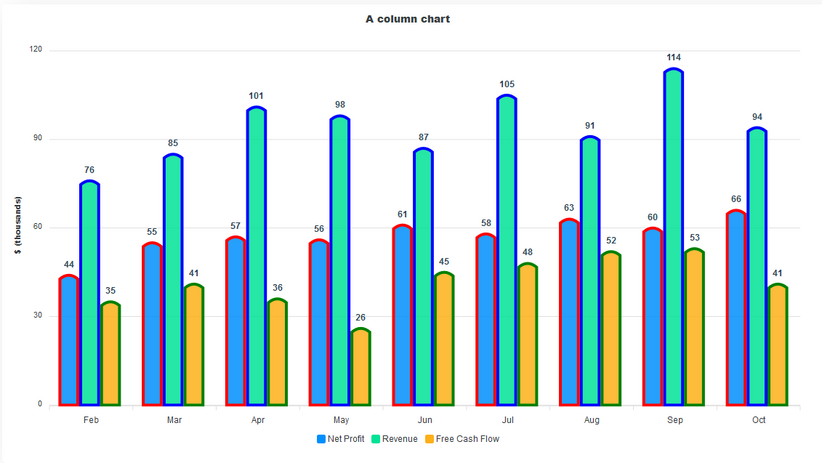
Conclusion

We have gone through some of the chart types ApexCharts provides and learned how to switch from one chart type to another. We have also seen some ways of customizing the appearance of our charts. There are still many things to discover, so dive into the ApexCharts docs right away.

Internationalization And Localization For Static Sites

Original Source: https://smashingmagazine.com/2020/11/internationalization-localization-static-sites/

Internationalization and localization is more than just writing your content in multiple languages. You need a strategy to determine what localization to send, and code to do it. You need to be able to support not just different languages, but different regions with the same language. Your UI needs to be responsive, not just to screen size, but to different languages and writing modes. Your content needs to be structured, down to the microcopy in your UI and the format of your dates, to be adaptable to any language you throw at it. Doing all of this with a static site generator, like Eleventy, can make it even harder, because you may not have a database, nonetheless a server. It can all be done, though, but it takes planning.

When building out chromeOS.dev, we knew that we needed to make it available to a global audience. Making sure that our codebase could support multiple locales (language, region, or combination of the two) without needing to custom-code each one, while allowing translation to be done with as little of that system’s knowledge as possible, would be critical to making this happen. Our content creators needed to be able to focus on creating content, and our translators on translating content, with as little work as possible to get their work into the site and deployed. Getting these sometimes conflicting set of needs right is the heart of what it takes to internationalize codebases and localize sites.

Internationalization (i18n) and localization (l10n) are two sides of the same coin. Internationalization is all about how, in our case, software, gets designed so that it can be adapted for multiple languages and regions without needing engineering changes. Localization, on the other hand, is about actually adapting the software for those languages and regions. Internationalization can happen across the whole website stack; from HTML, CSS, and JS to design considerations and build systems. Localization happens mostly in content creation (both long-form copy and microcopy) and management.

Note: For those curious, i18n and l10n are types of abbreviations known as numeronyms. A11y, for accessibility, is another common numeronym in web development.

Internationalization (i18n)

When figuring out internationalization, there are generally three items you need to consider: how to figure out what language and/or region the user wants, how to make sure they get content in their preferred localization, and how to adapt your site to adjust to those differences. While implementation specifics may change for dynamic sites (that render a page when a user requests it) and static sites (where pages are before getting deployed), the core concepts should stay the same.

Determining User’s Language And Region

The first thing to consider when figuring out internationalization is to determine how you want users to access localized content. This decision will become foundational to how you set up other systems, so it’s important to decide this early and ensure that the tradeoffs work well for your users.

Generally, there are three high-level ways of determining what localization to serve to users:

Location from IP address;
Accept-Language header or navigator.languages;
Identifier in URL.

Many systems wind up combining one, two, or all three, when deciding what localization to serve. As we were investigating, though, we found issues with using IP addresses and Accept-Language headers that we thought were significant enough to remove from consideration for us:

A user’s preferred language often doesn’t correlate to their physical location, which IP address provides. Just because someone is physically located in America, for instance, does not mean that they would prefer English content.
Location analysis from IP addresses is difficult, generally unreliable, and may prevent the site from being crawled by search engines.
Accept-Language headers are often never explicitly set, and only provide information about language, not region. Because of its limitations, this may be helpful to establish an initial guess about language, but isn’t necessarily reliable.

For these reasons, we decided that it would be better for us to not try and infer language or region before a user lands on our site, but rather have strong indicators in our URLs. Having strong indicators also allows us to assume that they’re getting the site in the language they want from their access URL alone, provides for an easy way to share localized content directly without concern of redirection, and provides a clean way for us to let users switch their preferred language.

There are three common patterns for building identifiers into URLs:

Provide different domains (usually TLDs or subdomains for different regions and languages (e.g. example.com and example.de, en.example.org and de.example.org);
Have localized sub-directories for content (e.g. example.com/en and example.com/de);
Serve localized content based on URL parameters (e.g. example.com?loc=en and example.com?loc=de).

While commonly used, URL parameters are generally not recommended because it’s difficult for users to recognize the localization (along with a number of analytics and management issues). We also decided that different domains weren’t a good solution for us; our site is a Progressive Web App and every domain, including TLDs and subdomains, are considered a different origin, effectively requiring a separate PWA for each localization.

We decided to use subdirectories, which provided a bonus of us being able to localize on language only (example.com/en) or language and region (example.com/en-US and example.com/en-GB) as needed while maintaining a single PWA. We also decided that every localization of our site would live in a subdirectory so one language isn’t elevated above another, and that all URLs, except for the subdirectory, would be identical across localizations based on the authoring language, allowing users to easily change localizations without needing to translate URLs.

Serving Localized Content

Once a strategy for determining a user’s language and region has been determined, you need a way to reliably serve them the right content. At a minimum, this will require some form of stored information, be it in a cookie, some local storage, or part of your app’s custom logic. Being able to keep a user’s localization preferences is an important part of i18n user experience; if a user has identified they want content in German, and they land on English content, you should be able to identify their preferred language and redirect them appropriately. This can be done on the server, but the solution we went with for chromeOS.dev is hosting and server setup agnostic: we used service workers. The user’s journey is as follows:

A user comes to our site for the first time. Our service worker isn’t installed.
Whatever localization they land on we set as their preferred language in IndexedDB. For this, we presume they’re landing there through some means, either social, referral, or search, that has directed them based on other localization contexts we don’t have. If a user lands without a localization set, we set it to English, as that’s our site’s primary language. We also have a language switcher in our footer to allow a user to change their language. At this point, our service worker should be installed.
After the service worker is installed, we intercept all URL requests for site navigation. Because our localizations are subdirectory based, we can readily identify what localization is being requested. Once identified, we check if the requested page is in a localized subdirectory, check if the localized subdirectory is in a list of supported localizations, and check if the localized subdirectory matches their preferences stored in IndexedDB. If it’s not in a localized subdirectory or the localized subdirectory matches their preferences, we serve the page; otherwise we do a 302 redirect from our service worker for the right localization.

We bundled our solution into Workbox plugin, Service Worker Internationalization Redirect. The plugin, along with its preferences sub-module, can be combined to set and get a user’s language preference and manage redirection when combined with Workbox’s registerRoute method and filtering requests on request.mode === ‘navigate’.

A full, minimal example looks like this:

Client Code

import { preferences } from ‘service-worker-i18n-redirect/preferences’;
window.addEventListener(‘DOMContentLoaded’, async () => {
const language = await preferences.get(‘lang’);
if (language === undefined) {
preferences.set(‘lang’, lang.value); // Language determined from localization user landed on
}
});

Service Worker Code

import { StaleWhileRevalidate } from ‘workbox-strategies’;
import { CacheableResponsePlugin } from ‘workbox-cacheable-response’;
import { i18nHandler } from ‘service-worker-i18n-redirect’;
import { preferences } from ‘service-worker-i18n-redirect/preferences’;
import { registerRoute } from ‘workbox-routing’;

// Create a caching strategy
const htmlCachingStrategy = new StaleWhileRevalidate({
cacheName: ‘pages-cache’,
plugins: [
new CacheableResponsePlugin({
statuses: [200],
}),
],
});

// Array of supported localizations
const languages = [‘en’, ‘es’, ‘fr’, ‘de’, ‘ko’];

// Use it for navigations
registerRoute(
({ request }) => request.mode === ‘navigate’,
i18nHandler(languages, preferences, htmlCachingStrategy),
);

With the combination of the client-side and service worker code, users’ preferred localization will automatically get set when they hit the site the first time and, if they navigate to a URL that isn’t in their preferred localizations, they’ll be redirected.

Adapting Site User Interface

There is a lot that goes into properly adapting user interfaces, so while not everything will be covered here, there are a handful of more subtle things that can and should be managed programmatically.

Blockquote Quotes

A common design pattern is having blockquotes wrapped in quotation marks, but did you know what gets used for those quotation marks varies with localization? Instead of hard-coding, use open-quote and close-quote to ensure the correct quotes are used for the correct language.

Date And Number Format

Both dates and numbers have a method, .toLocaleString to allow formatting based on a localization (language and/or region). Browsers that support these ship with all localizations available, making it readily usable there, but Node.js doesn’t. Fortunately, the full-icu module for Node allows you to use all of the localization data available. To do so, after installing the module, run your code with the NODE_ICU_DATA environment variable set to the path to the module, e.g. NODE_ICU_DATA=node_modules/full-icu.

HTML Meta Information

There are three areas in your HTML tag and headers that should be updated with each localization:

The page’s language,
Writing direction,
Alternative languages the page is available in.

The first to go on the html element with the dir and lang properties respectively, e.g. <html lang=”en” dir-“ltr”> for US English. Properly setting these will ensure content flows in the right direction and can allow browsers to understand what language the page is in, allowing additional features like translating the content. You should also include rel=”alternate” links to let search engines know that a page has been fully translated, so including <link href=”/es” rel=”alternate” hreflang=”es”> on our English landing page will let search engines know that this has a translation it should be on the lookout for.

Intrinsic Design

Localizing content can present design challenges as different translations will take up a varying amount of room on the page. Some languages, like German, have longer words requiring more horizontal space or more forgiving text wrapping. Other languages, like Arabic, have taller typefaces requiring more vertical space. Fortunately, there are a number of CSS tools for making spacing and layout responsive to not just the viewport size, but to the content as well, meaning they better adapt to multiple languages.

There are a number of CSS units specifically designed for working with content. There are the em and rem units representing the calculated font-size and root font-size, respectively. .Swapping fixed-size px values for these units can go a long way in making a site more responsive to its content. Then there’s the ch unit, representing the inline size of the 0 (zero) glyph in a font. This allows you to tie things like width, for instance, directly to the content it contains.

These units can then be combined with existing, powerful CSS tools for layout, specifically flexbox and grid, to components that adapt to their size, and layouts adapt to their content. Enhancing those with logical properties for borders, margins, and padding instead of physical physical properties makes those layouts and components automatically adapt to writing mode, too. The power of intrinsic web design (coined by Jen Simmons, content-aware units, and logical properties allows for interfaces to be designed and built so they can adapt to any language, not just any screen size.

Localization (l10n)

The most obvious form localization takes is translating content from one language to another. In more subtle forms, translations not only happen by language, but region it’s spoken, for instance, English spoken in American versus English spoken in the United Kingdom, South Africa, or Australia. To be successful here, understanding what to translate and how to structure your content for translation is critical to success.

Content Strategy

There are some parts of a software project that are important to localize, and some that aren’t. CSS class names, JavaScript variables, and other places in your codebase that are structural, but not user-facing, probably don’t need to be localized. Figuring out what needs to be localized, and how to structure it, comes down to content strategy.

Content strategy has a lot of definitions, but here it means the structure of content, microcopy (the words and phrases used throughout a project not tied to a specific piece of content), and the connections thereof. For more detailed information on content strategy, I’d recommend Content Strategy for Mobile by Karen McGrane and Designing Connected Content by Carrie Hane and Mike Atherton.

For chromeOS.dev, we wound up codifying content models that describe the structure of our content. Content models aren’t just for long-form article-like content; a content model should exist for any entity that a user may specifically want from you, like an author, document, or even reusable media assets. Good content models include individually-addressable pieces, or chunks, of a larger conceptual piece, while excluding chunks that are tangentially related or can be referenced from another content model. For instance, a content model for a blog post may include a title, an array of tags, a reference to an author, the date published, and the body of the post, but it shouldn’t include the string for breadcrumbs, or the author’s name and picture, which should be its own content model. Content models don’t change from localization to localization; they are site structure. An instance of a content model is tied to a localization, and those instances can be localized.

Content models only cover part of what needs to be localized, though. The rest—your “Read More” buttons, your “Menu” title, your disclaimer text—that’s all microcopy. Microcopy needs structure, too. While content models may feel natural to create, especially for template-driven sites, microcopy models tend to be less obvious and are often overlooked accidentally by writing what’s needed directly in a template.

By building content and microcopy models and enforcing them—through a content management system, linting, or review—you’re able to ensure that localization can focus on localizing.

Localize Values, Not Keys

Content and microcopy models usually generate structures akin to objects in a codebase; be it database entries, JSON object, YAML, or Front Matter. Don’t localize object keys! If you have your Search text microcopy located in a microcopy object at microcopy.search.text, don’t put it in a microcopie object at microcopie.chercher.texte. Keys in modules should be treated as localization-agnostic identifiers so they can be reliably used in reusable templates and relied upon throughout a codebase. This also means that object keys shouldn’t be displayed to end-users as content or microcopy.

Static Site Setup

For chromeOS.dev, we used Eleventy (11ty) with Nunjucks as our static site generator, but these recommendations for setting up a static site generator should be applicable to most static site generators. Where something is 11ty specific, it will be called out.

Folder Structure

Static site generators that compile based on folder structure are particularly good at supporting the subdirectory i18n method. 11ty also supports a data cascade with global data and a means of generating pages from data through pagination, so combining these three concepts yields a basic folder structure that looks like the following:

.
└── pages
├── _data
├── _generated
└── {{locale-code}}
├── {{locale-code}}.11tydata.js
├── _data
└── […content]

At a top-level, there’s a directory to hold the pages for a site, here called pages. Nested inside, there’s a _data folder containing global data files. This folder is important when talking about helpers next. Then, there’s a _generated folder. We have a number of pages that, instead of having their own content, are generated from existing content, small amounts of microcopy, or a combination of both. Think home a home page, a search page, or a blog section’s landing page. Because these pages are highly templated, we store the templates in the _generated folder and build them from there instead of having individual HTML or Markdown files for each. These folders are prefixed with an underscore to indicate that they don’t output pages directly underneath them, but rather are used to create pages elsewhere.

Next, l10n subdirectories! Each directory should be named for the BCP47 language tag (more commonly, locale code) for the localization it contains: for instance, en for English, or en-US for American English. In the chromeOS.dev codebase, we often refer to these as locales, too. These folders will become the localization subdirectories, segmenting content to a localization. 11ty’s data cascade allows for data to be available to every file in a directory and its children if the file is at the root of a directory and named the same as the directory (called directory data files). 11ty uses an object returned from this file, or a function that returns an object, and injects it into the variables made available for templating, so we have access to data here for all content of that localization.

To aid in maintainability of these files, we wrote a helper called l10n-data, part of our static site scaffolding, that takes advantage of this folder structure to build a cascade of localized data, allowing data to be localized piecemeal. It does this by having data stored in a locale-specific data directory, _data directory in it (loaded into the directory data file). If you look in our English locale data directory, for instance, you’ll see microcopy models like locale.json which defines the language code and writing direction that will then be rendered into our HTML, newsletter.yml which defines the microcopy needed for our newsletter signup, and a microcopy.yml file which includes general microcopy used in multiple places throughout the site that doesn’t fit into a more specific file. Everywhere any of this microcopy gets used, we pull it from this data made available through 11ty injecting data variables into our templates to use.

Microcopy tends to be the hardest to manage, while the rest of the content is mostly straight forward. Put your content, often Markdown files or HTML, into the localized subfolder. For static site generators that work on folder structure, the file name and folder structure of the content will typically map 1:1 to the final URL for that content, so a Markdown file at en/web/pwas.md would output to a URL en/web/pwa. Following our “values, not keys” principle of localization, we decided that we wouldn’t localize content file names (and therefore paths), making it easier for us to keep track of the same file’s localization status across locales and for users to know they’re on the right page between different locales.

I18n Helpers

In addition to content and microcopy, we found we needed to write a number of helpers modules to make working with localized content easier. 11ty has a concept called a filter that allows content to be modified before being rendered. We wound up building four of them to help with i18n templating.

The first is a date filter. We standardized on having all dates across our content written as a YAML date value because we mostly write them in YAML and they become available in our templates as a full UTC timestamp. When using the full-icu module and config, the date string (content being changed), along with the locale code for the content being rendered, can be passed directly to Date.toLocaleString (with optional formatting options) to render a localized date. Date.toLocaleDateString can optionally be used instead if you just want the date portion when no formatting options are passed in, instead of the full localized date and time.

The second filter is something we called localURL. This takes a local URL (content being changed) and the locale the URL should be in, and swaps them. It changes, for example, /en/linux to /es/linux.

The final two filters are about retrieving localized information from locale code alone. The third leverages the iso-639-10 module to transform a locale code into language name in the native language. This we use primarily for our language selector. The fourth uses the iso-i18n-countries module to retrieve a list of countries in that language. This we use primarily for building forms with country lists.

In addition to filters, 11ty has a concept called collections which is a grouping of content. 11ty makes a number of collections available by default, and can even build collections off of tags. In a multilingual site, we found that we wanted to build custom collections. We wound up building a number of helper functions to build collections based on localization. This allows us to do things like have location-specific tag collections or site section collections without needing to filter in our templates against all content on our site.

Our final, and most critical, helper was our site global data. Relying on the locale-code based subdirectory structure, this function dynamically determines what localizations the site supports. It builds a global variable, site, which includes the l10n property, containing all of the microcopy and localization-specific content from {{locale-code}}.11tydata.js. It also contains a languages property that lists all of the available locales as an array. Finally, the function outputs a JavaScript file detailing what languages are supported by the site and individual files for each entry in {{locale-code}}.11tydata.js, keyed per localization, all designed to be imported by our browser scripts. The heavy lifting of this file ties our static site to our front-end JavaScript with the single source of truth being the localization information we already need. It also allows us to programmatically generate pages based on our localizations by looping over site.l10n. This, combined with our localization-specific collections, let us use 11ty’s pagination to create localized home and news landing pages without maintaining separate HTML pages for each.

Conclusion

Getting internationalization and localization right can be difficult; understanding how different strategies and affect complexity is critical to making it easier. Pick an i18n strategy that is a natural fit for static sites, subdirectories, then build tools off that to automate parts of i18n and i10n from the content being produced. Build robust content and microcopy models. Leverage service workers for server-agnostic localization. Tie it all together with a design that’s responsive not just to screen size, but content. In the end you’ll have a site that your users of all locales will love that can be maintained by authors and translators as if it were a simple single-locale site.

Working with Forms in React

Original Source: https://www.sitepoint.com/work-with-forms-in-react/?utm_source=rss

Working with Forms in React

Almost every application needs to accept user input at some point, and this is usually achieved with the venerable HTML form and its collection of input controls. If you’ve recently started learning React, you’ve probably arrived at the point where you’re now thinking, “So how do I work with forms?”

This article will walk you through the basics of using forms in React to allow users to add or edit information. We’ll look at two different ways of working with input controls and the pros and cons of each. We’ll also take a look at how to handle validation, and some third-party libraries for more advanced use cases.

Uncontrolled Inputs

The most basic way of working with forms in React is to use what are referred to as “uncontrolled” form inputs. What this means is that React doesn’t track the input’s state. HTML input elements naturally keep track of their own state as part of the DOM, and so when the form is submitted we have to read the values from the DOM elements themselves.

In order to do this, React allows us to create a “ref” (reference) to associate with an element, giving access to the underlying DOM node. Let’s see how to do this:

class SimpleForm extends React.Component {
constructor(props) {
super(props);
// create a ref to store the DOM element
this.nameEl = React.createRef();
this.handleSubmit = this.handleSubmit.bind(this);
}

handleSubmit(e) {
e.preventDefault();
alert(this.nameEl.current.value);
}

render() {
return (
<form onSubmit={this.handleSubmit}>
<label>Name:
<input type=”text” ref={this.nameEl} />
</label>
<input type=”submit” name=”Submit” />
</form>
)
}
}

As you can see above, for a class-based component you initialize a new ref in the constructor by calling React.createRef, assigning it to an instance property so it’s available for the lifetime of the component.

In order to associate the ref with an input, it’s passed to the element as the special ref attribute. Once this is done, the input’s underlying DOM node can be accessed via this.nameEl.current.

Let’s see how this looks in a functional component:

function SimpleForm(props) {
const nameEl = React.useRef(null);

const handleSubmit = e => {
e.preventDefault();
alert(nameEl.current.value);
};

return (
<form onSubmit={handleSubmit}>
<label>Name:
<input type=”text” ref={nameEl} />
</label>
<input type=”submit” name=”Submit” />
</form>
);
}

There’s not a lot of difference here, other than swapping out createRef for the useRef hook.

Example: login form
function LoginForm(props) {
const nameEl = React.useRef(null);
const passwordEl = React.useRef(null);
const rememberMeEl = React.useRef(null);

const handleSubmit = e => {
e.preventDefault();

const data = {
username: nameEl.current.value,
password: passwordEl.current.value,
rememberMe: rememberMeEl.current.checked,
}

// Submit form details to login endpoint etc.
// …
};

return (
<form onSubmit={handleSubmit}>
<input type=”text” placeholder=”username” ref={nameEl} />
<input type=”password” placeholder=”password” ref={passwordEl} />
<label>
<input type=”checkbox” ref={rememberMeEl} />
Remember me
</label>
<button type=”submit” className=”myButton”>Login</button>
</form>
);
}

View on CodePen

While uncontrolled inputs work fine for quick and simple forms, they do have some drawbacks. As you might have noticed from the code above, we have to read the value from the input element whenever we want it. This means we can’t provide instant validation on the field as the user types, nor can we do things like enforce a custom input format, conditionally show or hide form elements, or disable/enable the submit button.

Fortunately, there’s a more sophisticated way to handle inputs in React.

Controlled Inputs

An input is said to be “controlled” when React is responsible for maintaining and setting its state. The state is kept in sync with the input’s value, meaning that changing the input will update the state, and updating the state will change the input.

Let’s see what that looks like with an example:

class ControlledInput extends React.Component {
constructor(props) {
super(props);
this.state = { name: ” };
this.handleInput = this.handleInput.bind(this);
}

handleInput(event) {
this.setState({
name: event.target.value
});
}

render() {
return (
<input type=”text” value={this.state.name} onChange={this.handleInput} />
);
}
}

As you can see, we set up a kind of circular data flow: state to input value, on change event to state, and back again. This loop allows us a lot of control over the input, as we can react to changes to the value on the fly. Because of this, controlled inputs don’t suffer from the limitations of uncontrolled ones, opening up the follow possibilities:

instant input validation: we can give the user instant feedback without having to wait for them to submit the form (e.g. if their password is not complex enough)
instant input formatting: we can add proper separators to currency inputs, or grouping to phone numbers on the fly
conditionally disable form submission: we can enable the submit button after certain criteria are met (e.g. the user consented to the terms and conditions)
dynamically generate new inputs: we can add additional inputs to a form based on the user’s previous input (e.g. adding details of additional people on a hotel booking)

Validation

As I mentioned above, the continuous update loop of controlled components makes it possible to perform continuous validation on inputs as the user types. A handler attached to an input’s onChange event will be fired on every keystroke, allowing you to instantly validate or format the value.

Continue reading
Working with Forms in React
on SitePoint.

Collective #632

Original Source: http://feedproxy.google.com/~r/tympanus/~3/15NlvEVzroM/

Copying is the way design works

Matthew Ström’s in-depth exploration into why designers have such a complicated relationship with copying.

Read it

This content is sponsored via Thought Leaders
Get a Free .design Domain Name Today!

A .design domain name allows you to create a more succinct, powerful, and elegant URL and email address. Get 1-year for free today.

Get it today

Getting Audio Visualizations working with Web Audio API

A great tutorial by Dwayne Harris on how to create an audio visualization based on the Web Audio API.

Read it

pet_cursor.js

Pet cursor (Neko cursor) is a simple JavaScript file that turns your website’s cursor into a cute animated pet. By Nathalie Lawhead.

Check it out

How to sanitize third-party content with vanilla JS to prevent cross-site scripting (XSS) attacks

Chris Ferdinandi takes a look at how XSS attacks work and how to prevent them.

Read it

How to Build an Expandable Comment Box

Learn how to recreate the Medium comment box from scratch using React Hooks.

Read it

Voxiom.io

A WebGL game inspired by Minecraft, Fortnite, Counter Strike, and Call of Duty. Read more about it here.

Check it out

Painting With the Web

Matthias Ott shares his thoughts on why designing and building for the Web should be more playful.

Read it

Setting Up Netlify Forms: In-Depth Tutorial

This tutorial shows how Netlify Forms makes it easy to handle contact forms.

Read it

Supershape

A beautiful demo where you can adjust the parameters of a shape made by Arnaud Di Nunzio.

Check it out

Writing a dog picture browser in ~200 lines of code

Christian Heilmann shows how he built a fun dog picture browser using the Dog.ceo API.

Read it

Algebraic Effects for React Developers

Reese Williams on building a mental model for React Hooks.

Read it

Bridging design and code with Variants

Read about Variants and updates to the Inspect panel of Figma that will help power up your design system.

Read it

Stories for VSCode

An extension that allows you to share Instagram-style stories from within Visual Studio Code. By Ben Awad.

Check it out

How to make CSS Animations

Patrícia Silva’s interactive guide to CSS Animations.

Read it

Web scraping with JS

Pavel Prokudin shows how to use ES2020, node, and browser APIs for web scraping.

Read it

Looking deep to have a big influence

Some very interesting insights from a jQuery maintainer.

Read it

Native CSS Masonry Layout In CSS Grid

There is now a specification for native CSS masonry layout, as part of the Grid Layout spec. In this article, Rachel Andrew explains how it works with the help of a couple of demos you can try out in Firefox Nightly.

Read it

Svelte rendering and SEO

How do you handle SEO with Svelte? Julien Maury explains.

Read it

Micro Frontends Pattern Comparison

Comparing build-time integration, server-side integration, run-time integration via iframes, and run-time integration via script.

Read it

How to Build HTML Forms Right: Styling

Part of a series on HTML form design patterns, common gotchas, and CSS tips.

Read it

The post Collective #632 appeared first on Codrops.

How to Organize a Large React Application and Make It Scale

Original Source: https://www.sitepoint.com/organize-large-react-application/?utm_source=rss

An astronaut constructing a space colony in the shape of the React logo

This article is by guest author Jack Franklin. SitePoint guest posts aim to bring you engaging content from prominent writers and speakers of the Web community.

In this article, I’ll discuss the approach I take when building and structuring large React applications. One of the best features of React is how it gets out of your way and is anything but descriptive when it comes to file structure. Therefore, you’ll find a lot of questions on Stack Overflow and similar sites asking how to structure applications. This is a very opinionated topic, and there’s no one right way. In this article, I’ll talk you through the decisions I make when building React applications: picking tools, structuring files, and breaking components up into smaller pieces.

An astronaut constructing a space colony in the shape of the React logo

Build Tools and Linting

It will be no surprise to some of you that I’m a huge fan of webpack for building my projects. Whilst it’s a complicated tool, the great work put into version 5 by the team and the new documentation site make it much easier. Once you get into webpack and have the concepts in your head, you really have incredible power to harness. I use Babel to compile my code, including React-specific transforms like JSX, and the webpack-dev-server to serve my site locally. I’ve not personally found that hot reloading gives me that much benefit, so I’m more than happy with webpack-dev-server and its automatic refreshing of the page.

I use ES Modules, first introduced in ES2015 (which is transpiled through Babel) to import and export dependencies. This syntax has been around for a while now, and although webpack can support CommonJS (aka, Node-style imports), it makes sense to me to start using the latest and greatest. Additionally, webpack can remove dead code from bundles using ES2015 modules which, whilst not perfect, is a very handy feature to have, and one that will become more beneficial as the community moves towards publishing code to npm in ES2015. The majority of the web ecosystem has moved towards ES Modules, so this is an obvious choice for each new project I start. It’s also what most tools expect to support, including other bundlers like Rollup, if you’d rather not use webpack.

Folder Structure

There’s no one correct folder structure for all React applications. (As with the rest of this article, you should alter it for your preferences.) But the following is what’s worked well for me.

Code lives in src

To keep things organized, I’ll place all application code in a folder called src. This contains only code that ends up in your final bundle, and nothing more. This is useful because you can tell Babel (or any other tool that acts on your app code) to just look in one directory and make sure it doesn’t process any code it doesn’t need to. Other code, such as webpack config files, lives in a suitably named folder. For example, my top-level folder structure often contains:

– src => app code here
– webpack => webpack configs
– scripts => any build scripts
– tests => any test specific code (API mocks, etc.)

Typically, the only files that will be at the top level are index.html, package.json, and any dotfiles, such as .babelrc. Some prefer to include Babel configuration in package.json, but I find those files can get large on bigger projects with many dependencies, so I like to use .eslintrc, .babelrc, and so on.

React Components

Once you’ve got a src folder, the tricky bit is deciding how to structure your components. In the past, I’d put all components in one large folder, such as src/components, but I’ve found that on larger projects this gets overwhelming very quickly.

A common trend is to have folders for “smart” and “dumb” components (also known as “container” and “presentational” components), but personally I’ve never found explicit folders work for me. Whilst I do have components that loosely categorize into “smart” and “dumb” (I’ll talk more on that below), I don’t have specific folders for each of them.

We’ve grouped components based on the areas of the application where they’re used, along with a core folder for common components that are used throughout (buttons, headers, footers — components that are generic and very reusable). The rest of the folders map to a specific area of the application. For example, we have a folder called cart that contains all components relating to the shopping cart view, and a folder called listings that contains code for listing things users can buy on a page.

Categorizing into folders also means you can avoid prefixing components with the area of the app they’re used for. As an example, if we had a component that renders the user’s cart total cost, rather than call it CartTotal I might prefer to use Total, because I’m importing it from the cart folder:

import Total from ‘../cart/total’
// vs
import CartTotal from ‘../cart/cart-total’

This is a rule I find myself breaking sometimes. The extra prefix can clarify, particularly if you have two to three similarly named components, but often this technique can avoid extra repetition of names.

Prefer the jsx Extension over Capital Letters

A lot of people name React components with a capital letter in the file, to distinguish them from regular JavaScript files. So in the above imports, the files would be CartTotal.js, or Total.js. I tend to prefer to stick to lowercase files with dashes as separators, so in order to distinguish I use the .jsx extension for React components. Therefore, I’d stick with cart-total.jsx.

This has the small added benefit of being able to easily search through just your React files by limiting your search to files with .jsx, and you can even apply specific webpack plugins to these files if you need to.

Whichever naming convention you pick, the important thing is that you stick to it. Having a combination of conventions across your codebase will quickly become a nightmare as it grows and you have to navigate it. You can enforce this .jsx convention using a rule from eslint-plugin-react.

One React Component per File

Following on from the previous rule, we stick to a convention of one React component file, and the component should always be the default export.

Normally our React files look like so:

import React from ‘react’

export default function Total(props) {

}

In the case that we have to wrap the component in order to connect it to a Redux data store, for example, the fully wrapped component becomes the default export:

import React, { Component, PropTypes } from ‘react’
import { connect } from ‘react-redux’

export default function Total(props) {

}

export default connect(() => {…})(Total)

You’ll notice that we still export the original component. This is really useful for testing, where you can work with the “plain” component and not have to set up Redux in your unit tests.

By keeping the component as the default export, it’s easy to import the component and know how to get at it, rather than having to look up the exact name. One downside to this approach is that the person importing can call the component anything they like. Once again, we’ve got a convention for this: the import should be named after the file. So if you’re importing total.jsx, the component should be imported as Total. user-header.jsx becomes UserHeader, and so on.

It’s worth noting that the one component per file rule isn’t always followed. If you end up building a small component to help you render part of your data, and it’s only going to be used in one place, it’s often easier to leave it in the same file as the component that uses it. There’s a cost to keeping components in separate files: there are more files, more imports and generally more to follow as a developer, so consider if it’s worth it. Like most of the suggestions in this article, they are rules with exceptions.

Continue reading
How to Organize a Large React Application and Make It Scale
on SitePoint.

Native CSS Masonry Layout In CSS Grid

Original Source: https://smashingmagazine.com/2020/11/native-css-masonry-layout-css-grid/

A Level 3 of the CSS Grid specification has been published as an Editor’s Draft, this level describes a way to do Masonry layout in CSS. In this article, I’ll explain the draft spec, with examples that you can try out in Firefox Nightly. While this is a feature you won’t be able to use in production right now, your feedback would be valuable to help make sure it serves the requirements that you have for this kind of layout. So let’s take a look.

What Is A Masonry Layout?

A masonry layout is one where items are laid out one after the other in the inline direction. When they move onto the next line, items will move up into any gaps left by shorter items in the first line. It’s similar to a grid layout with auto-placement, but without sticking to a strict grid for the rows.

The most well-known example of masonry is on Pinterest, and you will sometimes hear people refer to the layout as a “Pinterest layout”.

There are a number of JavaScript tools to help you create this kind of layout, such as David DeSandro’s Masonry plugin.

Can’t We Already Do This In CSS?

We can come close to a masonry layout in a couple of ways. The closest way to achieve the look of this type of layout is to use Multi-column Layout. In the example below, you see something which looks visually like a masonry layout. However, the order of the boxes runs down the columns. Therefore, if the first items have the highest priority (e.g. if this were search results), then the apparent first items in the top row aren’t actually the ones that came back first.

That’s all you need to do to get a simple masonry layout. Using Firefox, you can see that in the CodePen example below.

Note: You can use any of the values used for align-content for align-tracks and justify-tracks. There are some nice examples in the spec of different combinations.

If you set align-tracks: stretch, then any auto-sized items in the layout will stretch. The masonry effect is retained, but anything with a definite size on that axis will not be stretched out of shape.

See the Pen Masonry align-tracks: stretch by Rachel Andrew (@rachelandrew) on CodePen.

The align-tracks and justify-tracks properties can take multiple values. One for each track in the grid axis. This means that in our four-track grid we could have the first track stretching, the second aligned to start, the third aligned to end, and the fourth aligned to center.

This did not seem to work at the time of writing in Firefox.

The spec details that if there are fewer values than tracks, the remaining tracks will use the final specified value. If there are more values than tracks, additional ones will be ignored.

Fallback Behavior

The inclusion of this feature into the grid specification has a definite benefit where creating a fallback layout is concerned. As masonry behaves in a similar way to auto-placement, if a browser doesn’t support masonry then regular auto-placement can be used instead. This is likely to create the gaps in the layout as seen in the earlier example, but is certainly not terrible.

You can see this in action by looking at any of the demos so far using a browser with no support for masonry. You still get a layout. If you wanted to do something entirely different then you could check for support for masonry with feature queries. You could perhaps do the layout with multicol for non-supporting browsers.

@supports (grid-template-rows: masonry) {
/* masonry code here */
}

If the masonry layout is vital then you could check for masonry support using CSS.supports and only use the JavaScript masonry script if there is no support. This would mean that as browsers implement native masonry they would lose the overhead of the scripted version, but it would be there as a polyfill.

Potential Accessibility Concerns

While masonry in CSS is exciting, it is yet another place where content reordering and a disconnection of the document order from the visual order may happen. As I noted on a recent issue that was raised, I feel that we are creating exciting layout possibilities and then needing to tell people to be very careful how they use them.

I’ve written about this problem in Grid, content reordering, and accessibility. I hope that as we move forward with this specification, there are also renewed efforts to find a good way forward with regard to content vs. display order.

Your Feedback Is Needed

We are really lucky to not only have this new spec, but to have a browser implementation to test it in. If you have examples where you have used masonry, why not try replacing your JavaScript with the grid version and see if it works for you? If you run into problems or can’t do something you were able to do in your previous implementation, please let the CSSWG know by raising an issue.

While things are in an experimental state, this is your chance to help influence any changes and point out any problems. So please do, and help make this really great feature even better!

Higher-order Components: A React Application Design Pattern

Original Source: https://www.sitepoint.com/react-higher-order-components/?utm_source=rss

Higher-order Components: A React Application Design Pattern

In this article, we’ll discuss how to use higher-order components to keep your React applications tidy, well-structured and easy to maintain. We’ll discuss how pure functions keep code clean and how these same principles can be applied to React components.

Pure Functions

A function is considered pure if it adheres to the following properties:

all the data it deals with is declared as arguments
it doesn’t mutate data it was given or any other data (these are often referred to as side effects)
given the same input, it will always return the same output.

For example, the add function below is pure:

function add(x, y) {
return x + y;
}

However, the function badAdd below is impure:

let y = 2;
function badAdd(x) {
return x + y;
}

This function is not pure because it references data that it hasn’t directly been given. As a result, it’s possible to call this function with the same input and get different output:

let y = 2;
badAdd(3) // 5
y = 3;
badAdd(3) // 6

To read more about pure functions you can read “An introduction to reasonably pure programming” by Mark Brown.

Whilst pure functions are very useful, and make debugging and testing an application much easier, occasionally you’ll need to create impure functions that have side effects, or modify the behavior of an existing function that you’re unable to access directly (a function from a library, for example). To enable this, we need to look at higher-order functions.

Higher-order Functions

A higher-order function is a function that returns another function when it’s called. Often they also take a function as an argument, but this isn’t required for a function to be considered higher-order.

Let’s say we have our add function from above, and we want to write some code so that when we call it, we log the result to the console before returning the result. We’re unable to edit the add function, so instead we can create a new function:

function addAndLog(x, y) {
const result = add(x, y);
console.log(`Result: ${result}`);
return result;
}

We decide that logging results of functions is useful, and now we want to do the same with a subtract function. Rather than duplicate the above, we could write a higher-order function that can take a function and return a new function that calls the given function and logs the result before then returning it:

function logAndReturn(func) {
return function(…args) {
const result = func(…args)
console.log(‘Result’, result);
return result;
}
}

Now we can take this function and use it to add logging to add and subtract:

const addAndLog = logAndReturn(add);
addAndLog(4, 4) // 8 is returned, ‘Result 8’ is logged

const subtractAndLog = logAndReturn(subtract);
subtractAndLog(4, 3) // 1 is returned, ‘Result 1’ is logged;

logAndReturn is a higher-order function because it takes a function as its argument and returns a new function that we can call. These are really useful for wrapping existing functions that you can’t change in behavior. For more information on this, check M. David Green’s article “Higher-Order Functions in JavaScript”, which goes into much more detail on the subject.

See the Pen
Higher Order Functions by SitePoint (@SitePoint)
on CodePen.

Higher-order Components

Moving into React land, we can use the same logic as above to take existing React components and give them some extra behaviors.

Note: with the introduction of React Hooks, released in React 16.8, higher-order functions became slightly less useful because hooks enabled behavior sharing without the need for extra components. That said, they are still a useful tool to have in your belt.

In this section, we’re going to use React Router, the de facto routing solution for React. If you’d like to get started with the library, I highly recommend the React Router documentation as the best place to get started.

React Router’s Link component

React Router provides a <NavLink> component that’s used to link between pages in a React application. One of the properties that this <NavLink> component takes is activeClassName. When a <NavLink> has this property and it’s currently active (the user is on a URL that the link points to), the component will be given this class, enabling the developer to style it.

This is a really useful feature, and in our hypothetical application we decide that we always want to use this property. However, after doing so we quickly discover that this is making all our <NavLink> components very verbose:

<NavLink to=”/” activeClassName=”active-link”>Home</NavLink>
<NavLink to=”/about” activeClassName=”active-link”>About</NavLink>
<NavLink to=”/contact” activeClassName=”active-link”>Contact</NavLink>

Notice that we’re having to repeat the class name property every time. Not only does this make our components verbose, it also means that if we decide to change the class name we’ve got to do it in a lot of places.

Instead, we can write a component that wraps the <NavLink> component:

const AppLink = (props) => {
return (
<NavLink to={props.to} activeClassName=”active-link”>
{props.children}
</NavLink>
);
};

And now we can use this component, which tidies up our links:

<AppLink to=”/home” exact>Home</AppLink>
<AppLink to=”/about”>About</AppLink>
<AppLink to=”/contact”>Contact</AppLink>

In the React ecosystem, these components are known as higher-order components, because they take an existing component and manipulate it slightly without changing the existing component. You can also think of these as wrapper components, but you’ll find them commonly referred to as higher-order components in React-based content.

Continue reading
Higher-order Components: A React Application Design Pattern
on SitePoint.

Justinmind 9 is here! UI Design and Prototyping Come Together

Original Source: http://feedproxy.google.com/~r/1stwebdesigner/~3/0uho0yQgfHs/

In case you are unaware, Justinmind is an all-in-one UI design, wireframing and prototyping platform for web and mobile apps. It lets you preview ideas on various screens, including web browsers, Android and iOS. The drag-and-drop interface makes it easier for beginners to get started using templates and customize them according to their own requirements. The platform comes with UI Kits preloaded that enable you to design beautiful interfaces with clickable regions and functional UI prototypes. Transitions, gestures, animations, effects and more are also covered, while data tables, smart forms and dynamic behavior ensure realistic simulation of your ideas.

Now version 9 of Justinmind has been released with a revamped UI, frictionless developer handoff, 10x speed increase, and dozens of new design features. In this article, we are going to take a look at the improvements in this latest version so you can see why you should give Justinmind a try, if you aren’t already using it.

Revamped Workspace UI

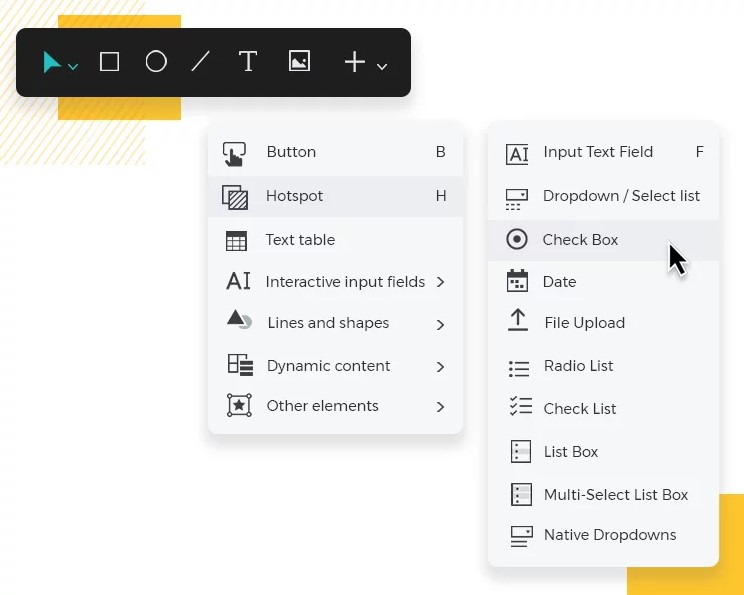
The latest release emphasizes your user experience, so that everything appears where you need it, when you need it. With a new toolbar design that contains a multitude of shortcuts, repetitive tasks can be performed at a fraction of previous speeds. For example, by simply dragging and pressing the CMD key for Mac or the CTRL button for Windows, you can insert dynamic panels and other containers onto the canvas quickly and easily.

Align tools, with screen and template guides, allow you to align elements even if there is only a single element on the canvas. Resizing is also easier using the new aspect ratio constraint feature.

Justinmind - toolbar

10 Times Faster – Even With Huge Prototypes!

In this new version of Justinmind, the platform’s performance has been dramatically increased to make it 10 times faster than before. This speed increase will greatly improve your production time, which translates to increased revenue.

Justinmind - 10 times faster

Enhanced Handoff From Designers To Developers

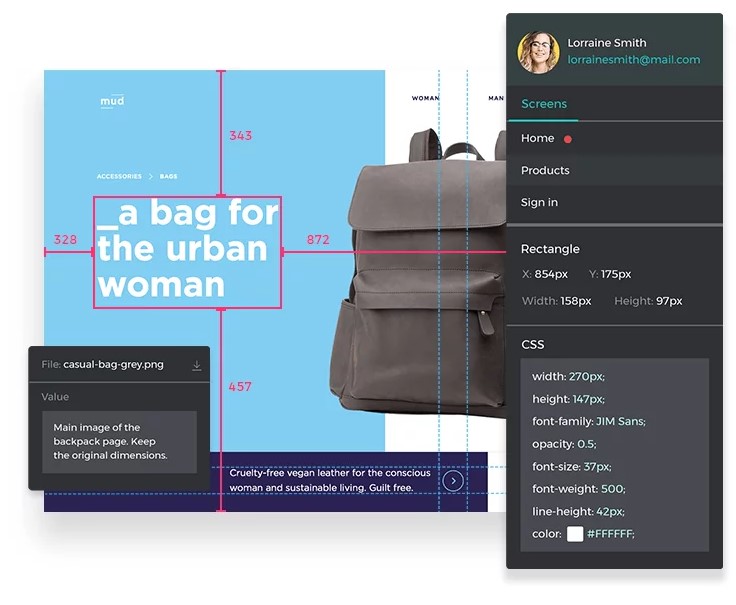
In today’s collaborative work environments, it’s important to provide frictionless handoffs from designers to developers. Justinmind 9 does just that, with a web-based element where developers can inspect a prototype’s assets, inspect CSS styles, red line, and get other general information. The developers do not even have to have the software installed or download prototypes!

Justinmind - developer handoff

New Design Features

No more switching back and forth between design and prototyping tools – you can do it all in Justinmind 9! Check out some of the new features listed below:

Direct Selection Tool – select single elements that are inside containers or grouped together.
Pixel Perfect Text Editing – Text editing now matches 100% with text visualization. You can also preview all your fonts by using the fonts selector.
Enhanced Zooming – newly tweaked super-fast precision zoom feature.
Widget Preview – preview UI widgets in their libraries before dragging them on to the canvas for editing.
Redesigned Color Palette – new much more varied and seasoned color palette, with increased transparency in gradients.

Justinmind - design features

Many More New Features Make Justinmind 9 A Must To Try

Whether you are already using Justinmind, or you’ve never tried it before, these new developments in the latest release make it a must to try out as a tool in your design and prototyping arsenal. Best of all, it’s absolutely free to download and give a thorough run through, with an affordable price starting at $19 USD per user per month. There is even a completely free version with limitations after the 15-day full-featured trial runs out. So give it a try and start improving your design and prototyping efficiency today!


30 Bewitched Halloween Wallpapers (4K)

Original Source: https://www.hongkiat.com/blog/beautiful-halloween-wallpapers/

Halloween, which falls on the 31th of October is a holiday that normally associated with symbols like “Jack o’ Lanterns“, skeleton, pumpkins and activities like bonfire, costume…

Visit hongkiat.com for full content.