CSS Auditing Tools
Original Source: https://smashingmagazine.com/2021/03/css-auditing-tools/
How large is your CSS? How repetitive is it? What about your CSS specificity score? Can you safely remove some declarations and vendor prefixes, and if so, how do you spot them quickly? Over the last few weeks, we’ve been working on refactoring and cleaning up our CSS, and as a result, we stumbled upon a couple of useful tools that helped us identify duplicates. So let’s review some of them.
More On CSS:
Comprehensive Guide To CSS Layout
Managing CSS Z-Index
How To Align Things In CSS
Things You Can Do With CSS Today
Useful DevTools Tips and Shortcuts
Also, subscribe to our newsletter to not miss the next ones.
CSS Stats
CSS Stats runs a thorough audit of the CSS files requested on a page. Like many similar tools, it provides a dashboard-alike view of rules, selectors, declarations and properties, along with pseudo-classes and pseudo-elements. It also breaks down all styles into groups, from layout and structure to spacing, typography, font stacks and colors.

One of the useful features that CSS Stats provides is the CSS specificity score, showing how unnecessarily specific some of the selectors are. Lower scores and flatter curves are better for maintainability.

It also includes an overview of colors used, printed by declaration order, and a score for Total vs. Unique declarations, along with the comparison charts that can help you identify which properties might be the best candidates for creating abstractions. That’s a great start to understand where the main problems in your CSS lie, and what to focus on.
Yellow Lab Tools
Yellow Lab Tools, is a free tool for auditing web performance, but it also includes some very helpful helpers for measure the complexity of your CSS — and also provides actionable insights into how to resolve these issues.

The tool highlights duplicated selectors and properties, old IE fixes, old vendor prefixes and redundant selectors, along with complex selectors and syntax errors. Obviously, you can dive deep into each of the sections and study which selectors or rules specifically are overwritten or repeated. That’s a great option to discover some of the low-hanging fruits and resolve them quickly.

We can go a bit deeper though. Once you tap into the overview of old vendor prefixes, you can not only check the offenders but also which browsers these prefixes are accommodating for. Then you can head to your Browserslist configuration to double-check if you aren’t serving too many vendor prefixes, and test your configuration on Browsersl.ist or via Terminal.
Project Wallace
Unlike other tools, Project Wallace, created by Bart Veneman, additionally keeps the history of your CSS over time. You can use webhooks to automatically analyze CSS on every push in your CI. The tool tracks the state of your CSS over time by looking into specific CSS-related metrics such as average selector per rule, maximum selectors per rule and declarations per rule, along with a general overview of CSS complexity.

Parker
Katie Fenn’s Parker is a command-line stylesheet analysis tool that runs metrics on your stylesheets and reports on their complexity. It runs on Node.js, and, unlike CSS Stats, you can run it to measure your local files, e.g. as a part of your build process.
DevTools CSS Auditing
Of course, we can also use DevTools’ CSS overview panel. (You can enable it in the “Experimental Settings”). Once you capture a page, it provides an overview of media queries, colors and font declarations, but also highlights unused declarations which you can safely remove.
Also, CSS coverage returns an overview of unused CSS on a page. You could even go a bit further and bulk find unused CSS/JS with Puppeteer.
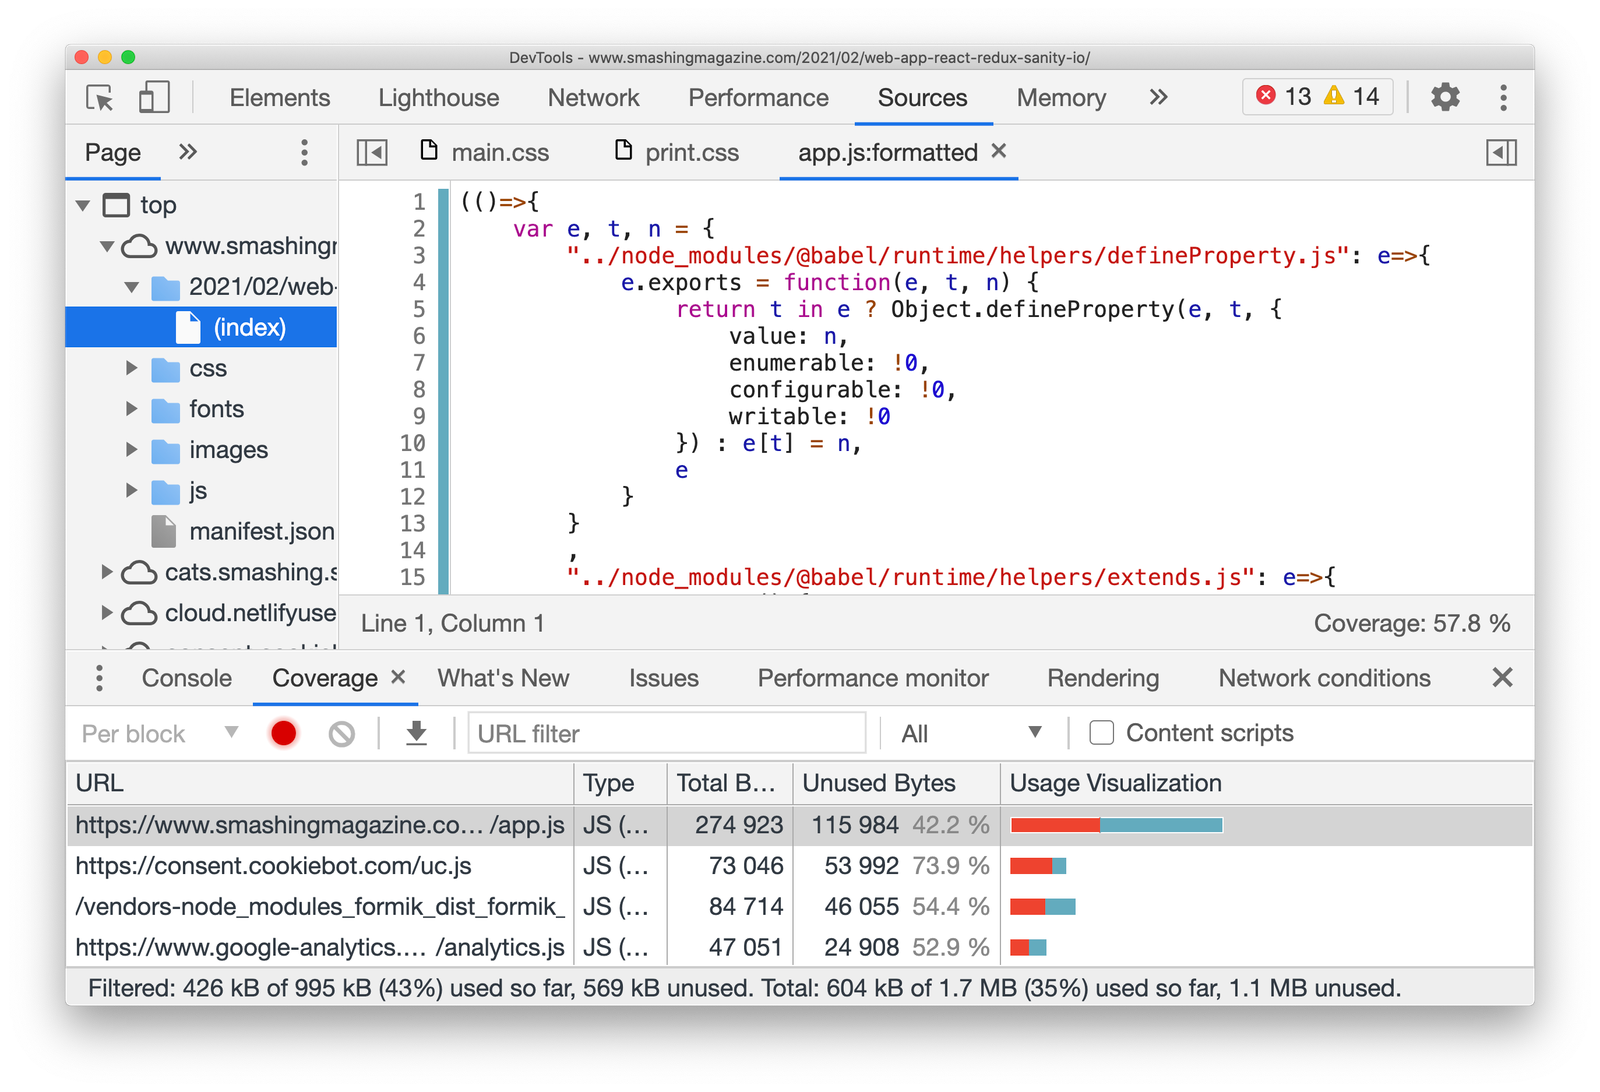
With “Code coverage” in place, going through a couple of scenarios that include a lot of tapping, tabbing and window resizing, we also export coverage data that DevTools collects as JSON (via the export/download icon). On top of that, you could use Puppeteer that also provides an API to collect coverage.
We’ve highlighted some of the details, and a few further DevTools tips in Chrome, Firefox, and Edge in Useful DevTools Tips And Shortcuts here on Smashing Magazine.
What Tools Are You Using?
Ideally, a CSS auditing tool would provide some insights about how heavily CSS implact rendering performance, and which operations lead to expensive layout recalculations. It could also highlight what properties don’t affect the rendering at all (like Firefox DevTools does it), and perhaps even suggest how to write slightly more efficient CSS selectors.
These are just a few tools that we’ve discovered — we’d love to hear your stories and your tools that work well to identify the bottlenecks and fix CSS issues faster. Please leave a comment and share your story in the comments!
You can also subscribe to our friendly email newsletter to not miss next posts like this one. And, of course, happy CSS auditing and debugging!


Leave a Reply
Want to join the discussion?Feel free to contribute!