Browser DevTools Secrets: Start-up, Network and Performance
Original Source: https://www.sitepoint.com/browser-devtools-secrets-start-up-network-and-performance/

During the past decade, browser development tools (browser DevTools) have evolved from basic JavaScript consoles to fully-integrated development and debugging environments. It’s become possible to alter and inspect any aspect of your web application but few of us venture beyond the basics.
In this series of articles, we’ll explore a range of features you may or may not have considered. Chrome’s DevTools are described in most cases but alternative options are shown for Firefox where available.
Keyboard Shortcuts
Using a menu to launch DevTools wastes valuable seconds! Try one of these options instead:
F12
ctrl + shift + i
cmd + option + j
or right-click any element on the page and choose Inspect or Inspect Element.
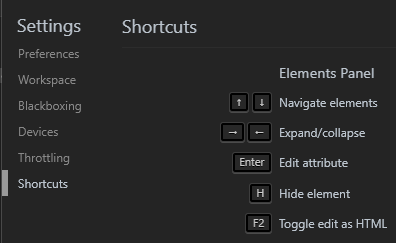
Chrome provides useful keyboard shortcut assistance. From DevTools, press F1 or select Settings from the three-dot menu at the top-right. Then choose Shortcuts from the menu:
Docking
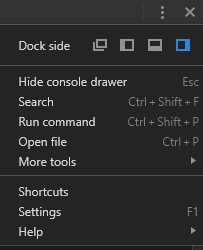
The DevTools pane can be docked to the left, right or bottom of the browser window. If you require more room, undock it to a separate window. Docking options are found in the main three-dot menu in Chrome:
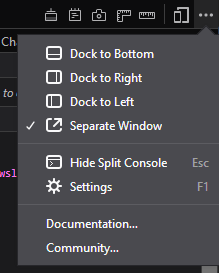
and Firefox:
Settings
DevTool settings can be accessed from the same menu or by pressing F1. This allows you to set options such as the tools shown, theme, tab sizes, color units and more.
Auto-start DevTools
When working on a web application, it may be practical to create a dedicated desktop shortcut to launch your browser, open the URL and launch DevTools in a single step. For Chrome, create a desktop icon with the following Chrome command-line options:
chrome –auto-open-devtools-for-tabs http://localhost:8000/
where http://localhost:8000/ is your development URL.
Similarly for Firefox:
firefox -devtools -url http://localhost:8000/
(The executable name may differ across systems.)
Go Incognito During Development
Incognito/private mode does not retain data such as cookies and localStorage after the browser is closed. The mode is ideal for testing Progressive Web Apps (PWAs) and log-in systems.
You can start browsers in incognito mode manually or by adding –incognito to Chrome or -private to Firefox’s command line.
Command Palette
Chrome DevTools offers an editor-like command palette. Press ctrl + shift + p:
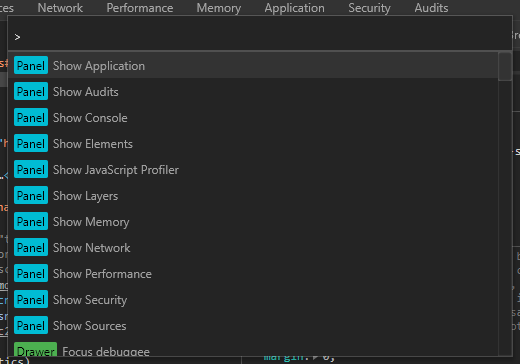
It provides quick access to most functions and source files (hit backspace to remove the >).
Escape to the Console
The console is useful regardless of which DevTool panel you’re using. Hit Esc to show and hide a console window in the bottom pane.
Find Page Colors
Most browsers show a color picker when you click any CSS color property. Chrome also shows the colors used in the page at the bottom of the panel:
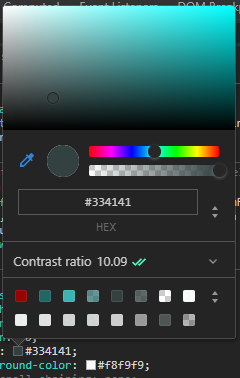
The panel can be clicked to show further colors.
Color Contrast Accessibility
The color picker also shows the contrast ratio which indicates the visual difference between the foreground text and background color. Click the ratio to view how this rates against AA and AAA accessibility standards which ensure text can be read by most people:
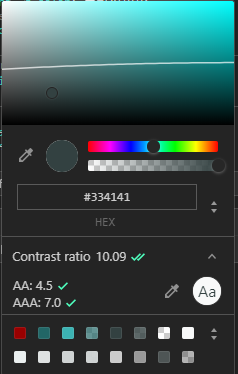
Any color below the line on the color swash will pass AA contrast recommendations.
The post Browser DevTools Secrets: Start-up, Network and Performance appeared first on SitePoint.


Leave a Reply
Want to join the discussion?Feel free to contribute!