Reporting Core Web Vitals With The Performance API

Original Source: https://smashingmagazine.com/2024/02/reporting-core-web-vitals-performance-api/

This article is a sponsored by DebugBear

There’s quite a buzz in the performance community with the Interaction to Next Paint (INP) metric becoming an official Core Web Vitals (CWV) metric in a few short weeks. If you haven’t heard, INP is replacing the First Input Delay (FID) metric, something you can read all about here on Smashing Magazine as a guide to prepare for the change.

But that’s not what I really want to talk about. With performance at the forefront of my mind, I decided to head over to MDN for a fresh look at the Performance API. We can use it to report the load time of elements on the page, even going so far as to report on Core Web Vitals metrics in real time. Let’s look at a few ways we can use the API to report some CWV metrics.

Browser Support Warning

Before we get started, a quick word about browser support. The Performance API is huge in that it contains a lot of different interfaces, properties, and methods. While the majority of it is supported by all major browsers, Chromium-based browsers are the only ones that support all of the CWV properties. The only other is Firefox, which supports the First Contentful Paint (FCP) and Largest Contentful Paint (LCP) API properties.

So, we’re looking at a feature of features, as it were, where some are well-established, and others are still in the experimental phase. But as far as Core Web Vitals go, we’re going to want to work in Chrome for the most part as we go along.

First, We Need Data Access

There are two main ways to retrieve the performance metrics we care about:

Using the performance.getEntries() method, or
Using a PerformanceObserver instance.

Using a PerformanceObserver instance offers a few important advantages:

PerformanceObserver observes performance metrics and dispatches them over time. Instead, using performance.getEntries() will always return the entire list of entries since the performance metrics started being recorded.
PerformanceObserver dispatches the metrics asynchronously, which means they don’t have to block what the browser is doing.
The element performance metric type doesn’t work with the performance.getEntries() method anyway.

That all said, let’s create a PerformanceObserver:

const lcpObserver = new PerformanceObserver(list => {});

For now, we’re passing an empty callback function to the PerformanceObserver constructor. Later on, we’ll change it so that it actually does something with the observed performance metrics. For now, let’s start observing:

lcpObserver.observe({ type: “largest-contentful-paint”, buffered: true });

The first very important thing in that snippet is the buffered: true property. Setting this to true means that we not only get to observe performance metrics being dispatched after we start observing, but we also want to get the performance metrics that were queued by the browser before we started observing.

The second very important thing to note is that we’re working with the largest-contentful-paint property. That’s what’s cool about the Performance API: it can be used to measure very specific things but also supports properties that are mapped directly to CWV metrics. We’ll start with the LCP metric before looking at other CWV metrics.

Reporting The Largest Contentful Paint

The largest-contentful-paint property looks at everything on the page, identifying the biggest piece of content on the initial view and how long it takes to load. In other words, we’re observing the full page load and getting stats on the largest piece of content rendered in view.

We already have our Performance Observer and callback:

const lcpObserver = new PerformanceObserver(list => {});
lcpObserver.observe({ type: “largest-contentful-paint”, buffered: true });

Let’s fill in that empty callback so that it returns a list of entries once performance measurement starts:

// The Performance Observer
const lcpObserver = new PerformanceObserver(list => {
// Returns the entire list of entries
const entries = list.getEntries();
});

// Call the Observer
lcpObserver.observe({ type: “largest-contentful-paint”, buffered: true });

Next, we want to know which element is pegged as the LCP. It’s worth noting that the element representing the LCP is always the last element in the ordered list of entries. So, we can look at the list of returned entries and return the last one:

// The Performance Observer
const lcpObserver = new PerformanceObserver(list => {
// Returns the entire list of entries
const entries = list.getEntries();
// The element representing the LCP
const el = entries[entries.length – 1];
});

// Call the Observer
lcpObserver.observe({ type: “largest-contentful-paint”, buffered: true });

The last thing is to display the results! We could create some sort of dashboard UI that consumes all the data and renders it in an aesthetically pleasing way. Let’s simply log the results to the console rather than switch gears.

// The Performance Observer
const lcpObserver = new PerformanceObserver(list => {
// Returns the entire list of entries
const entries = list.getEntries();
// The element representing the LCP
const el = entries[entries.length – 1];

// Log the results in the console
console.log(el.element);
});

// Call the Observer
lcpObserver.observe({ type: “largest-contentful-paint”, buffered: true });

There we go!

It’s certainly nice knowing which element is the largest. But I’d like to know more about it, say, how long it took for the LCP to render:

// The Performance Observer
const lcpObserver = new PerformanceObserver(list => {

const entries = list.getEntries();
const lcp = entries[entries.length – 1];

entries.forEach(entry => {
// Log the results in the console
console.log(
The LCP is:,
lcp.element,
The time to render was ${entry.startTime} milliseconds.,
);
});
});

// Call the Observer
lcpObserver.observe({ type: “largest-contentful-paint”, buffered: true });

// The LCP is:
// <h2 class=”author-post__title mt-5 text-5xl”>…</h2>
// The time to render was 832.6999999880791 milliseconds.

Reporting First Contentful Paint

This is all about the time it takes for the very first piece of DOM to get painted on the screen. Faster is better, of course, but the way Lighthouse reports it, a “passing” score comes in between 0 and 1.8 seconds.

Just like we set the type property to largest-contentful-paint to fetch performance data in the last section, we’re going to set a different type this time around: paint.

When we call paint, we tap into the PerformancePaintTiming interface that opens up reporting on first paint and first contentful paint.

// The Performance Observer
const paintObserver = new PerformanceObserver(list => {
const entries = list.getEntries();
entries.forEach(entry => {
// Log the results in the console.
console.log(
The time to ${entry.name} took ${entry.startTime} milliseconds.,
);
});
});

// Call the Observer.
paintObserver.observe({ type: “paint”, buffered: true });

// The time to first-paint took 509.29999999981374 milliseconds.
// The time to first-contentful-paint took 509.29999999981374 milliseconds.

Notice how paint spits out two results: one for the first-paint and the other for the first-contenful-paint. I know that a lot happens between the time a user navigates to a page and stuff starts painting, but I didn’t know there was a difference between these two metrics.

Here’s how the spec explains it:

“The primary difference between the two metrics is that [First Paint] marks the first time the browser renders anything for a given document. By contrast, [First Contentful Paint] marks the time when the browser renders the first bit of image or text content from the DOM.”

As it turns out, the first paint and FCP data I got back in that last example are identical. Since first paint can be anything that prevents a blank screen, e.g., a background color, I think that the identical results mean that whatever content is first painted to the screen just so happens to also be the first contentful paint.

But there’s apparently a lot more nuance to it, as Chrome measures FCP differently based on what version of the browser is in use. Google keeps a full record of the changelog for reference, so that’s something to keep in mind when evaluating results, especially if you find yourself with different results from others on your team.

Reporting Cumulative Layout Shift

How much does the page shift around as elements are painted to it? Of course, we can get that from the Performance API! Instead of largest-contentful-paint or paint, now we’re turning to the layout-shift type.

This is where browser support is dicier than other performance metrics. The LayoutShift interface is still in “experimental” status at this time, with Chromium browsers being the sole group of supporters.

As it currently stands, LayoutShift opens up several pieces of information, including a value representing the amount of shifting, as well as the sources causing it to happen. More than that, we can tell if any user interactions took place that would affect the CLS value, such as zooming, changing browser size, or actions like keydown, pointerdown, and mousedown. This is the lastInputTime property, and there’s an accompanying hasRecentInput boolean that returns true if the lastInputTime is less than 500ms.

Got all that? We can use this to both see how much shifting takes place during page load and identify the culprits while excluding any shifts that are the result of user interactions.

const observer = new PerformanceObserver((list) => {
let cumulativeLayoutShift = 0;
list.getEntries().forEach((entry) => {
// Don’t count if the layout shift is a result of user interaction.
if (!entry.hadRecentInput) {
cumulativeLayoutShift += entry.value;
}
console.log({ entry, cumulativeLayoutShift });
});
});

// Call the Observer.
observer.observe({ type: “layout-shift”, buffered: true });

Given the experimental nature of this one, here’s what an entry object looks like when we query it:

Pretty handy, right? Not only are we able to see how much shifting takes place (0.128) and which element is moving around (article.a.main), but we have the exact coordinates of the element’s box from where it starts to where it ends.

Reporting Interaction To Next Paint

This is the new kid on the block that got my mind wondering about the Performance API in the first place. It’s been possible for some time now to measure INP as it transitions to replace First Input Delay as a Core Web Vitals metric in March 2024. When we’re talking about INP, we’re talking about measuring the time between a user interacting with the page and the page responding to that interaction.

We need to hook into the PerformanceEventTiming class for this one. And there’s so much we can dig into when it comes to user interactions. Think about it! There’s what type of event happened (entryType and name), when it happened (startTime), what element triggered the interaction (interactionId, experimental), and when processing the interaction starts (processingStart) and ends (processingEnd). There’s also a way to exclude interactions that can be canceled by the user (cancelable).

const observer = new PerformanceObserver((list) => {
list.getEntries().forEach((entry) => {
// Alias for the total duration.
const duration = entry.duration;
// Calculate the time before processing starts.
const delay = entry.processingStart – entry.startTime;
// Calculate the time to process the interaction.
const lag = entry.processingStart – entry.startTime;

// Don’t count interactions that the user can cancel.
if (!entry.cancelable) {
console.log(`INP Duration: ${duration}`);
console.log(`INP Delay: ${delay}`);
console.log(`Event handler duration: ${lag}`);
}
});
});

// Call the Observer.
observer.observe({ type: “event”, buffered: true });

Reporting Long Animation Frames (LoAFs)

Let’s build off that last one. We can now track INP scores on our website and break them down into specific components. But what code is actually running and causing those delays?

The Long Animation Frames API was developed to help answer that question. It won’t land in Chrome stable until mid-March 2024, but you can already use it in Chrome Canary.

A long-animation-frame entry is reported every time the browser couldn’t render page content immediately as it was busy with other processing tasks. We get an overall duration for the long frame but also a duration for different scripts involved in the processing.

const observer = new PerformanceObserver((list) => {
list.getEntries().forEach((entry) => {
if (entry.duration > 50) {
// Log the overall duration of the long frame.
console.log(Frame took ${entry.duration} ms)
console.log(Contributing scripts:)
// Log information on each script in a table.
entry.scripts.forEach(script => {
console.table({
// URL of the script where the processing starts
sourceURL: script.sourceURL,
// Total time spent on this sub-task
duration: script.duration,
// Name of the handler function
functionName: script.sourceFunctionName,
// Why was the handler function called? For example,
// a user interaction or a fetch response arriving.
invoker: script.invoker
})
})
}
});
});

// Call the Observer.
observer.observe({ type: “long-animation-frame”, buffered: true });

When an INP interaction takes place, we can find the closest long animation frame and investigate what processing delayed the page response.

There’s A Package For This

The Performance API is so big and so powerful. We could easily spend an entire bootcamp learning all of the interfaces and what they provide. There’s network timing, navigation timing, resource timing, and plenty of custom reporting features available on top of the Core Web Vitals we’ve looked at.

If CWVs are what you’re really after, then you might consider looking into the web-vitals library to wrap around the browser Performance APIs.

Need a CWV metric? All it takes is a single function.

webVitals.getINP(function(info) {
console.log(info)
}, { reportAllChanges: true });

Boom! That reportAllChanges property? That’s a way of saying we only want to report data every time the metric changes instead of only when the metric reaches its final value. For example, as long as the page is open, there’s always a chance that the user will encounter an even slower interaction than the current INP interaction. So, without reportAllChanges, we’d only see the INP reported when the page is closed (or when it’s hidden, e.g., if the user switches to a different browser tab).

We can also report purely on the difference between the preliminary results and the resulting changes. From the web-vitals docs:

function logDelta({ name, id, delta }) {
console.log(`${name} matching ID ${id} changed by ${delta}`);
}

onCLS(logDelta);
onINP(logDelta);
onLCP(logDelta);

Measuring Is Fun, But Monitoring Is Better

All we’ve done here is scratch the surface of the Performance API as far as programmatically reporting Core Web Vitals metrics. It’s fun to play with things like this. There’s even a slight feeling of power in being able to tap into this information on demand.

At the end of the day, though, you’re probably just as interested in monitoring performance as you are in measuring it. We could do a deep dive and detail what a performance dashboard powered by the Performance API is like, complete with historical records that indicate changes over time. That’s ultimately the sort of thing we can build on this — we can build our own real user monitoring (RUM) tool or perhaps compare Performance API values against historical data from the Chrome User Experience Report (CrUX).

Or perhaps you want a solution right now without stitching things together. That’s what you’ll get from a paid commercial service like DebugBear. All of this is already baked right in with all the metrics, historical data, and charts you need to gain insights into the overall performance of a site over time… and in real-time, monitoring real users.

DebugBear can help you identify why users are having slow experiences on any given page. If there is slow INP, what page elements are these users interacting with? What elements often shift around on the page and cause high CLS? Is the LCP typically an image, a heading, or something else? And does the type of LCP element impact the LCP score?

To help explain INP scores, DebugBear also supports the upcoming Long Animation Frames API we looked at, allowing you to see what code is responsible for interaction delays.

The Performance API can also report a list of all resource requests on a page. DebugBear uses this information to show a request waterfall chart that tells you not just when different resources are loaded but also whether the resources were render-blocking, loaded from the cache or whether an image resource is used for the LCP element.

In this screenshot, the blue line shows the FCP, and the red line shows the LCP. We can see that the LCP happens right after the LCP image request, marked by the blue “LCP” badge, has finished.

DebugBear offers a 14-day free trial. See how fast your website is, what’s slowing it down, and how you can improve your Core Web Vitals. You’ll also get monitoring alerts, so if there’s a web vitals regression, you’ll find out before it starts impacting Google search results.

Elevate Your Online Store with Top WooCommerce Plugins

Original Source: https://www.sitepoint.com/elevate-your-online-store-with-top-woocommerce-plugins/?utm_source=rss

Elevate Your Online Store with Top WooCommerce Plugins

Our streamlined guide compares crucial features, usability, and value-for-money to help you choose the plugins that fit your specific needs.

Continue reading
Elevate Your Online Store with Top WooCommerce Plugins
on SitePoint.

Branding and Visual Identity for Compe Consulting Firm

Original Source: https://abduzeedo.com/branding-and-visual-identity-compe-consulting-firm

Branding and Visual Identity for Compe Consulting Firm

abduzeedo0220—24

Discover the art of branding and visual identity with Compe’s project, highlighting how competent, reliable partnerships drive business success.

In today’s competitive business landscape, establishing a robust branding and visual identity is paramount for companies striving for distinction and reliability. The Compe project, meticulously designed by Douglas Alff, serves as an exemplary case study in achieving these goals.

Compe, a management consulting firm, positions itself as a beacon of competence and reliability for its clients. The genesis of its name, rooted in the concept of ‘competence,’ instantly communicates the firm’s pledge to deliver outstanding results. This strategic choice in naming underscores the importance of a meaningful and reflective brand identity in connecting with the target audience.

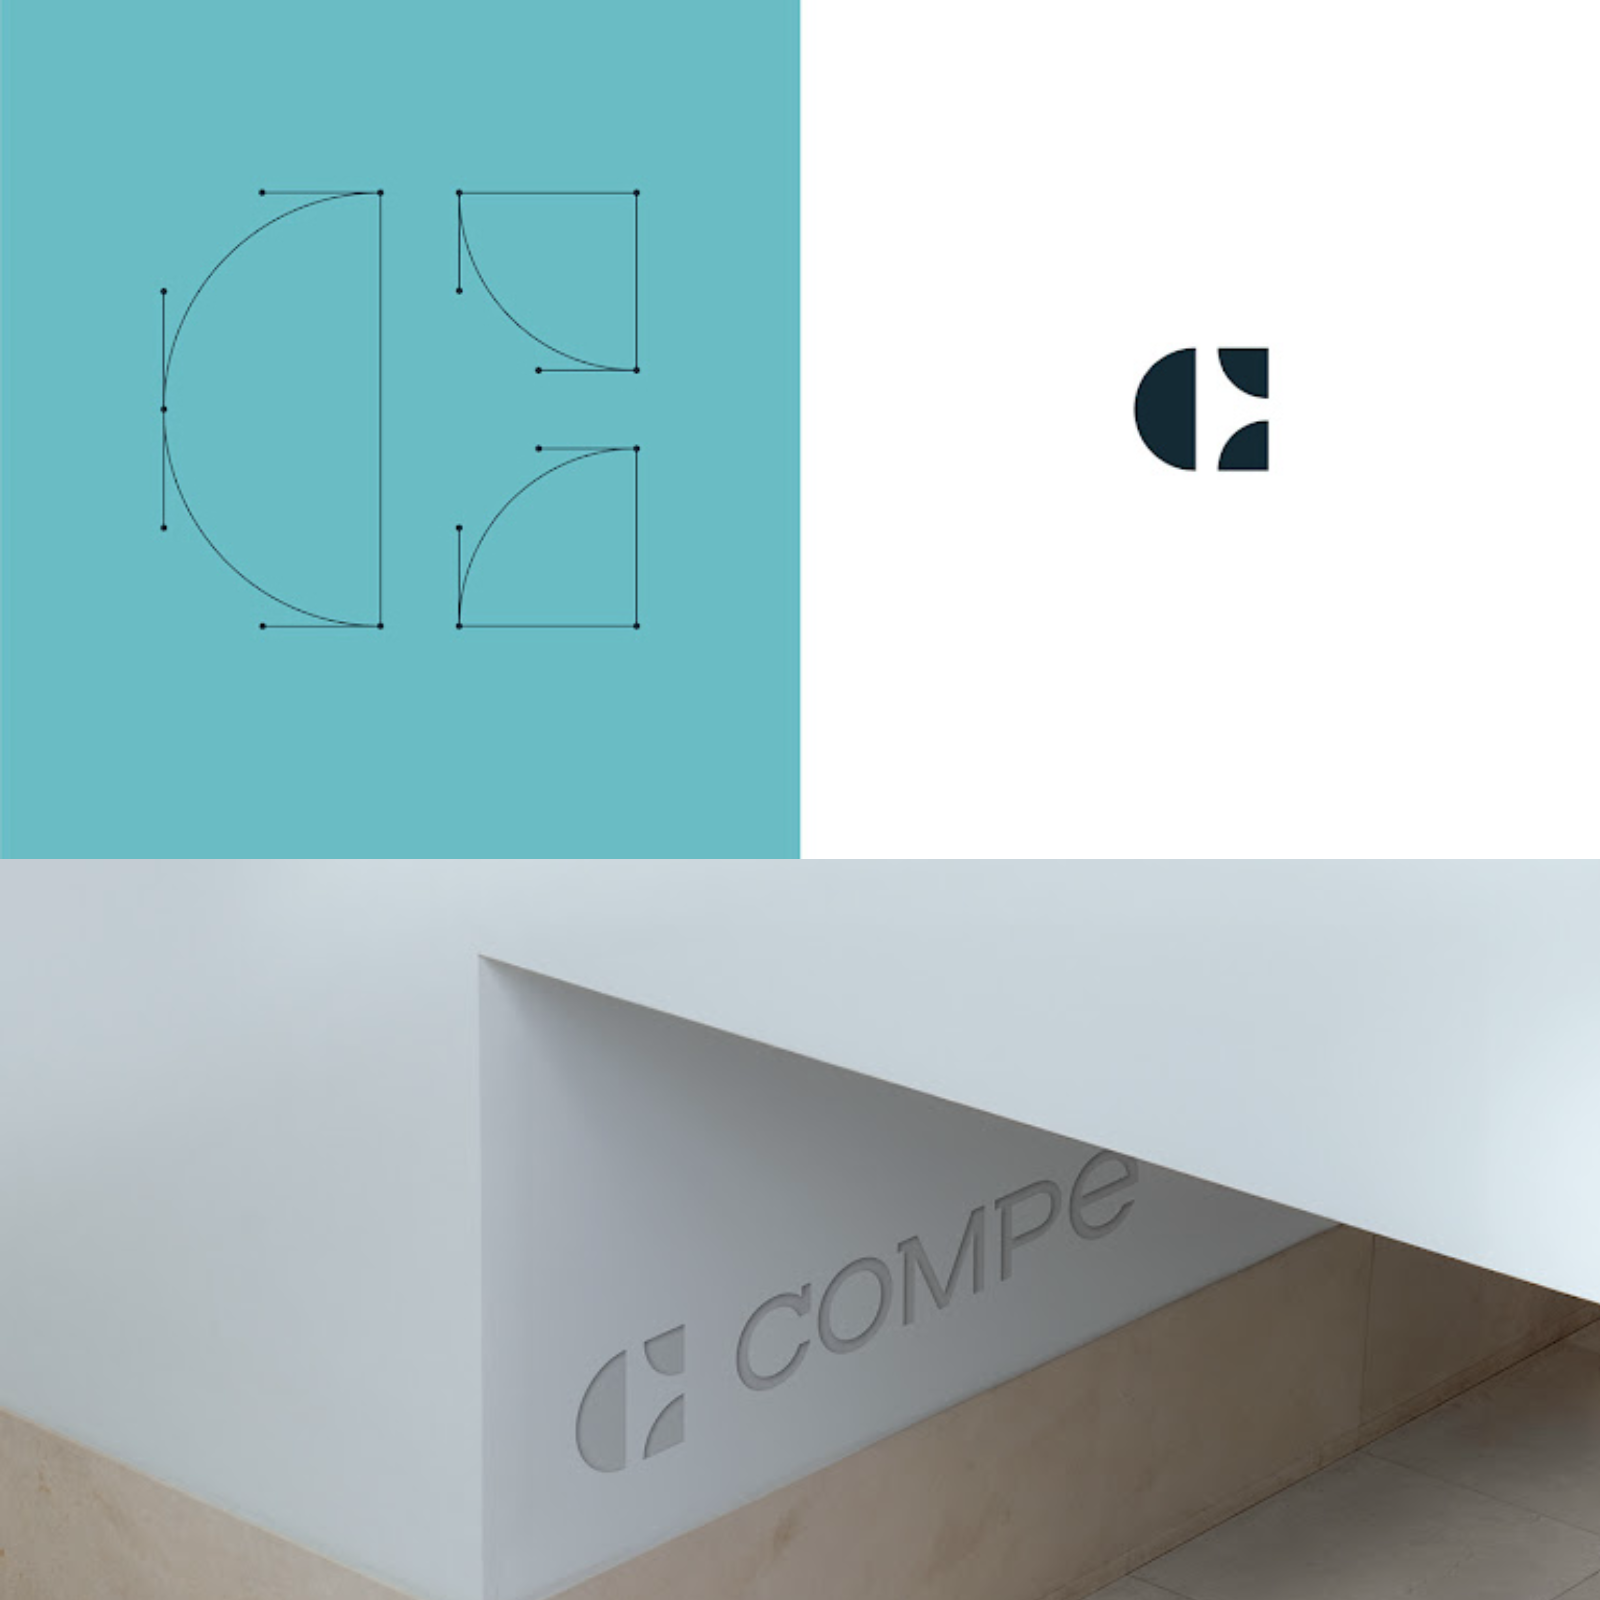
Central to Compe’s visual identity is its symbol, ingeniously inspired by a magnet. This choice is emblematic of the company’s ability to attract and establish a strong connection with its clientele, signifying a magnetic allure in the realm of business consulting. Compe’s typography, a blend of modernity with a hint of serifs, further reinforces this message. The typographic decision not only exudes authority and trust but also mirrors Compe’s expertise and credibility in the industry.

The color palette selected for Compe is deliberate, aiming to evoke a sense of authority, sophistication, tranquility, and stability. These colors are not merely aesthetic choices but are deeply emblematic of Compe’s core values and professional demeanor in tackling the intricate challenges of management consulting.

Moreover, the incorporation of unique and dynamic graphics introduces a layer of personality and movement into Compe’s branding. These visual elements distinctively position Compe in the marketplace, reflecting its innovative and progressive ethos. This approach to visual identity exemplifies how design can encapsulate and convey a company’s forward-thinking vision and its journey towards future advancements.

The Compe project, with its coherent blend of naming, symbolism, typography, color, and graphics, exemplifies the essence of effective branding and visual identity. It stands as a testament to the power of design in crafting a compelling brand narrative that resonates with clients and distinguishes a company in its field.

Branding and visual identity artifacts

Logo Design brand identity visual identity Logotype logo Work  brand branding  identityLogo Design brand identity visual identity Logotype logo Work  brand branding  identityLogo Design brand identity visual identity Logotype logo Work  brand branding  identityLogo Design brand identity visual identity Logotype logo Work  brand branding  identityLogo Design brand identity visual identity Logotype logo Work  brand branding  identityLogo Design brand identity visual identity Logotype logo Work  brand branding  identityLogo Design brand identity visual identity Logotype logo Work  brand branding  identityLogo Design brand identity visual identity Logotype logo Work  brand branding  identityLogo Design brand identity visual identity Logotype logo Work  brand branding  identityLogo Design brand identity visual identity Logotype logo Work  brand branding  identityLogo Design brand identity visual identity Logotype logo Work  brand branding  identityLogo Design brand identity visual identity Logotype logo Work  brand branding  identityLogo Design brand identity visual identity Logotype logo Work  brand branding  identityLogo Design brand identity visual identity Logotype logo Work  brand branding  identity

For more information make sure to check out Douglas’ website (douglasalff.com.br) and and Instagram @alffdesign.


A Practical Guide To Designing For Colorblind People

Original Source: https://smashingmagazine.com/2024/02/designing-for-colorblindness/

Too often, accessibility is seen as a checklist, but it’s much more complex than that. We might be using a good contrast for our colors, but then, if these colors are perceived very differently by people, it can make interfaces extremely difficult to use.

Depending on our color combinations, people with color weakness or who are colorblind won’t be able to tell them apart. Here are key points for designing with colorbliness — for better and more reliable color choices.

This article is part of our ongoing series on design patterns. It’s also a part of the video library on Smart Interface Design Patterns 🍣 and is available in the live UX training as well.

Colorweakness and Colorblindness

It’s worth stating that, like any other disability, colorblind users are on the spectrum, as Bela Gaytán rightfully noted. Each experience is unique, and different people perceive colors differently. The grades of colorblindness vary significantly, so there is no consistent condition that would be the same for everyone.

When we speak about colors, we should distinguish between two different conditions that people might have. Some people experience deficiencies in “translating” light waves into red-ish, green-ish or blue-ish colors. If one of these translations is not working properly, a person is at least colorweak. If the translation doesn’t work at all, a person is colorblind.

Depending on the color combinations we use, people with color weakness or people who are colorblind won’t be able to tell them apart. The most common use case is a red-/green deficiency, which affects 8% of European men and 0.5% of European women.

Note: the insights above come from “How Your Colorblind And Colorweak Readers See Your Colors,” a wonderful three-part series by Lisa Charlotte Muth on how colorblind and color weak readers perceive colors, things to consider when visualizing data and what it’s like to be colorblind.

Design Guidelines For Colorblindness

As Gareth Robins has kindly noted, the safe option is to either give people a colorblind toggle with shapes or use a friendly ubiquitous palette like viridis. Of course, we should never ever ask a colorblind person, “What color is this?” as they can’t correctly answer that question.

✅ Red-/green deficiencies are more common in men.
✅ Use blue if you want users to perceive color as you do.
✅ Use any 2 colors as long as they vary by lightness.
✅ Colorbrlind users can tell red and green apart.
✅ Colorbrlind users can’t tell dark green and brown apart.
✅ Colorbrlind users can’t tell red and brown apart.
✅ The safest color palette is to mix blue with orange or red.

🚫 Don’t mix red, green and brown together.
🚫 Don’t mix pink, turquoise and grey together.
🚫 Don’t mix purple and blue together.
🚫 Don’t use green and pink if you use red and blue.
🚫 Don’t mix green with orange, red, or blue of the same lightness.

Never Rely On Colors Alone

It’s worth noting that the safest bet is to never rely on colors alone to communicate data. Use labels, icons, shapes, rectangles, triangles, and stars to indicate differences and show relationships. Be careful when combining hues and patterns: patterns change how bright or dark colors will be perceived.

Who Can Use? is a fantastic little tool to quickly see how a color palette affects different people with visual impairments — from reduced sensitivity to red, to red/green blindness to cataracts, glaucoma, low vision and even situational events such as direct sunlight and night shift mode.

Use lightness to build gradients, not just hue. Use different lightnesses in your gradients and color palettes so readers with a color vision deficiency will still be able to distinguish your colors. And most importantly, always include colorweak and colorblind people in usability testing.

Useful Resources on Colorblindness

“How I Live With Color Blindness,” by Andy Baio
Who Can Use This Color Combination?, by Corey Ginnivan
Colorblind Accessibility Manifesto, by Federico Monaco
“Designing for Colorblind Access,” by Alex Chen
“The UX of Among Us: The Importance of Colorblind-friendly Design,” by Unma Desai
“How To Choose Colors For Data Visualization,” by Lisa Charlotte Muth
“Improving The UX For Color-Blind Users,” by Adam Silver
“How To Test With Blind Users: A Cheatsheet,” by Slava Shestopalov, Eugene Shykiriavyi

Useful Colorblindness Tools

Coblis, Color Blindness Simulator
Colorblindness Web Page Filters
Color Blindness Simulator Figma Plugin, by Sam Mason de Caires
Colorblindly Chrome Extension, by Andrew Van Ness

Meet Smart Interface Design Patterns

If you are interested in similar insights around UX, take a look at Smart Interface Design Patterns, our 10h-video course with 100s of practical examples from real-life projects — with a live UX training starting March 7. Everything from mega-dropdowns to complex enterprise tables — with 5 new segments added every year. Jump to a free preview.

Meet Smart Interface Design Patterns, our video course on interface design & UX.

Jump to the video course →

100 design patterns & real-life
examples.
10h-video course + live UX training. Free preview.

The 10 Best WordPress Quiz Plugins in 2024

Original Source: https://www.webdesignerdepot.com/the-10-best-wordpress-quiz-plugins-in-2024/

Whether it’s boosting your organic search visibility or collecting data for targeted email marketing campaigns, a great quiz can do wonders for your website. In this guide, we’re going to reveal ten WordPress quiz plugins you need to know about.

Understanding React useEffect

Original Source: https://www.sitepoint.com/understanding-react-useeffect/?utm_source=rss

This article provides a comprehensive understanding of the powerful useEffect hook, its usage, and best practices.

Continue reading
Understanding React useEffect
on SitePoint.

How Accessibility Standards Can Empower Better Chart Visual Design

Original Source: https://smashingmagazine.com/2024/02/accessibility-standards-empower-better-chart-visual-design/

Data visualizations are graphics that leverage our visual system and innate capabilities to gather, accumulate, and process information in our environment, as shown in the animation in Figure 1.0.

Figure 1.0. An animation demonstrating our preattentive processing capability. Based on a lecture by Dr. Stephen Franconeri. (Large preview)
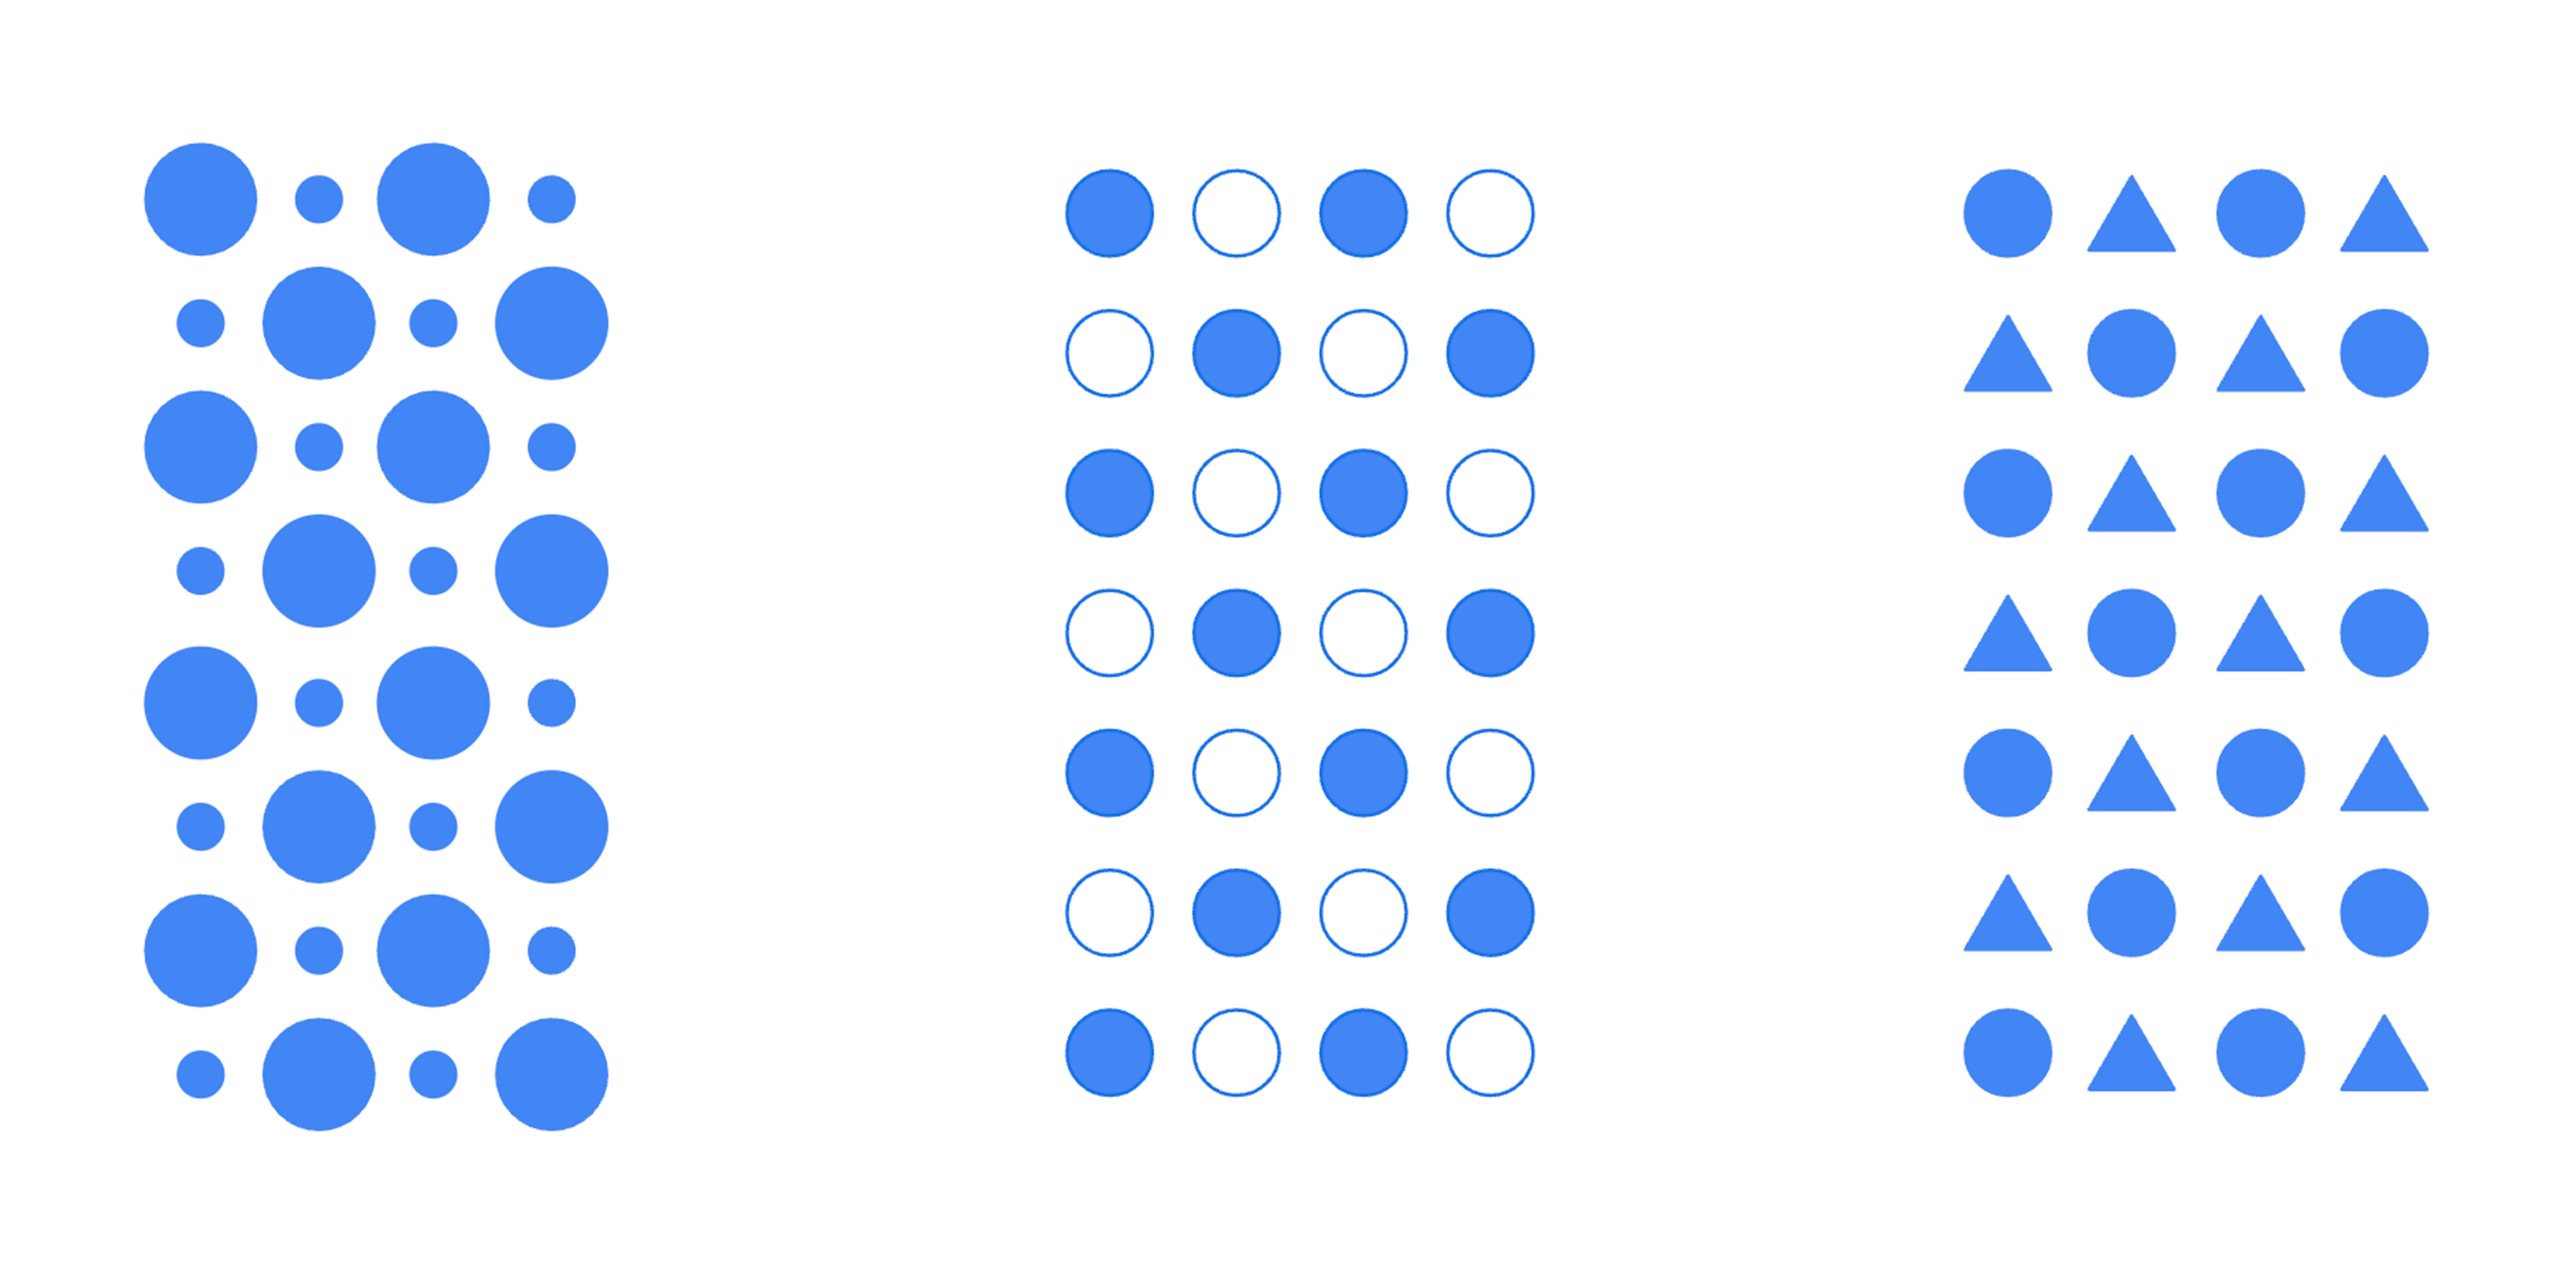
As a result, we’re able to quickly spot trends, patterns, and outliers in all the images we see. Can you spot the visual patterns in Figure 1.1?

In this example, there are patterns defined by the size of the shapes, the use of fills and borders, and the use of different types of shapes. These characteristics, or visual encodings, are the building blocks of visualizations. Good visualizations provide a glanceable view of a large data set we otherwise wouldn’t be able to comprehend.

Accessibility Challenges With Data Visualizations

Visualizations typically serve a wide array of use cases and can be quite complex. A lot of care goes into choosing the right encodings to represent each metric. Designers and engineers will use colors to draw attention to more important metrics or information and highlight outliers. Oftentimes, as these design decisions are made, considerations for people with vision disabilities are missed.

Vision disabilities affect hundreds of millions of people worldwide. For example, about 300 million people have color-deficient vision, and it’s a condition that affects 1 in 12 men.1

1 Colour Blind Awareness (2023)

Most people with these conditions don’t use assistive technology when viewing the data. Because of this, the visual design of the chart needs to meet them where they are.

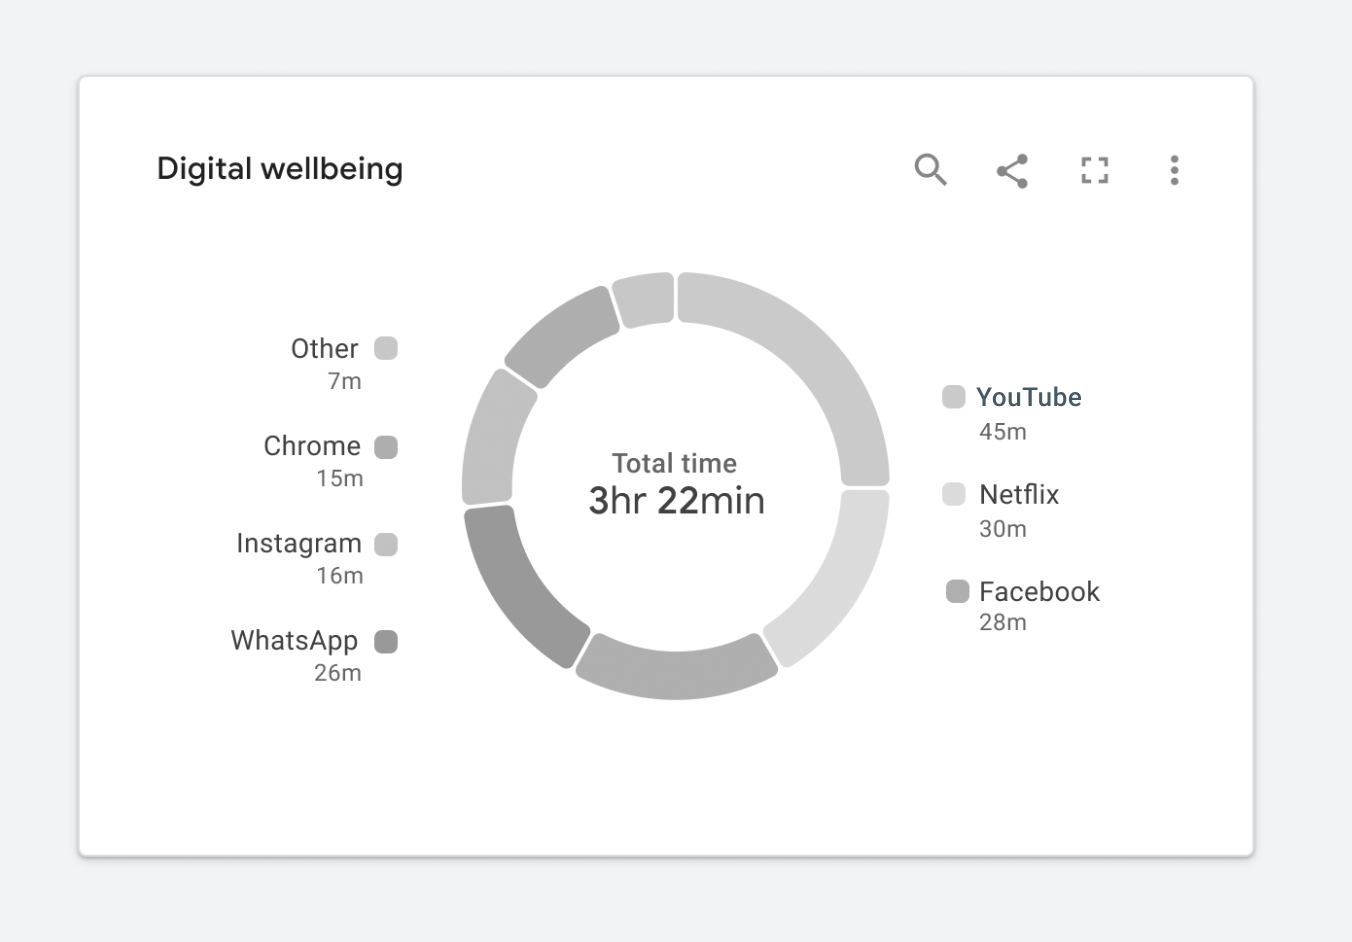
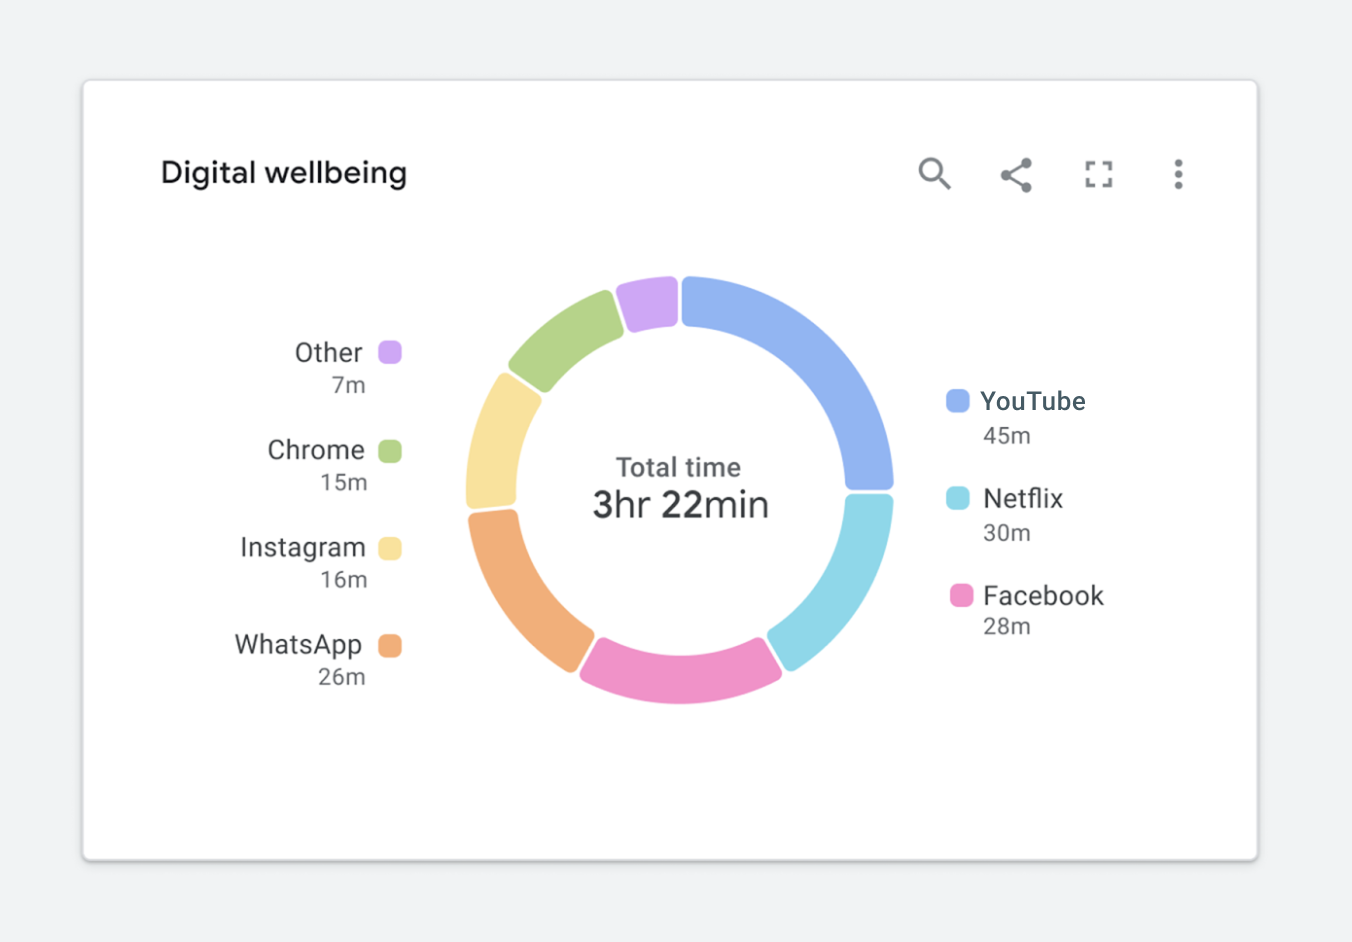
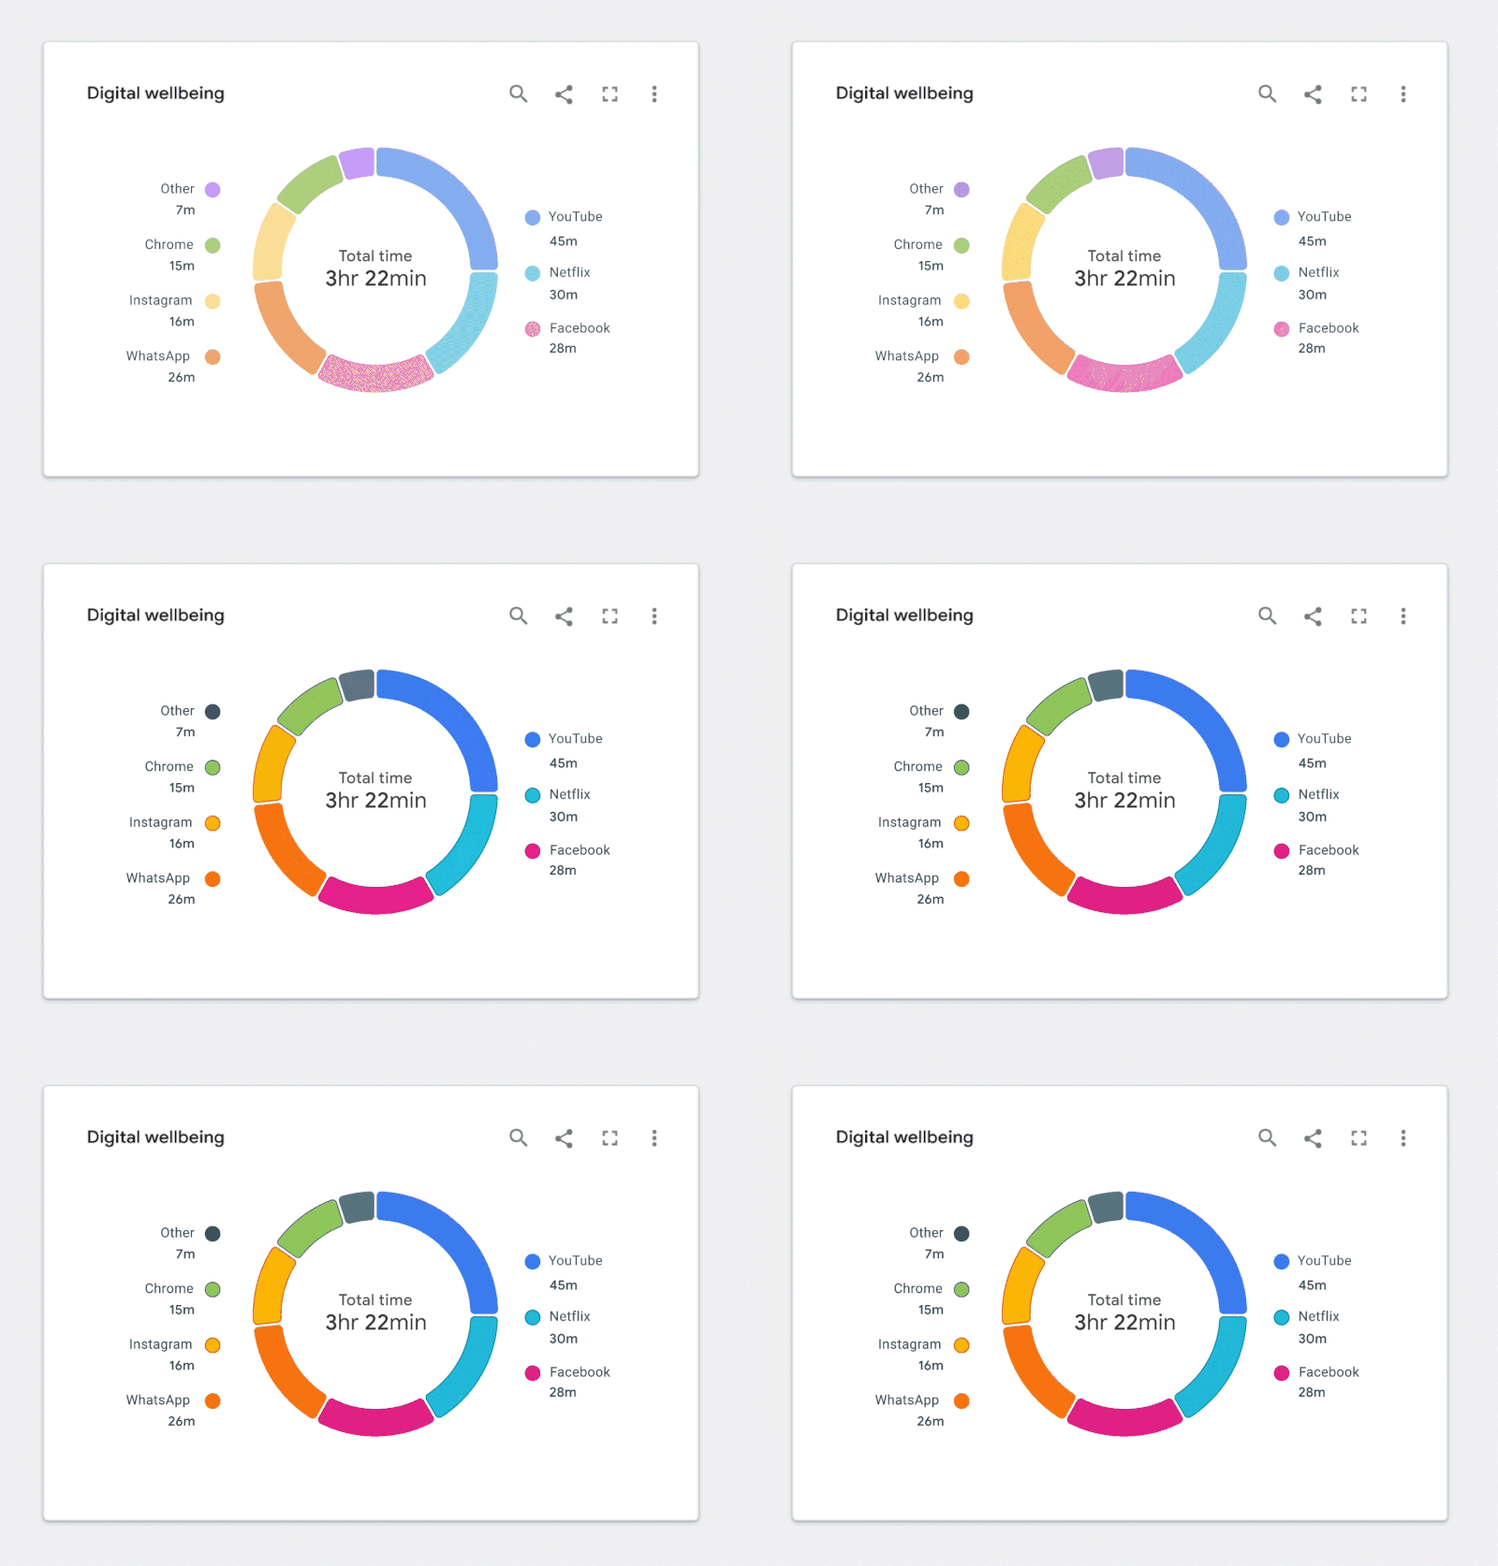
Figure 1.2 is an example of a donut chart. At first glance, it might seem like the categorical color palette matches the theme of digital wellbeing. It’s calm, it’s cool, and it may even invoke a feeling of wellbeing.

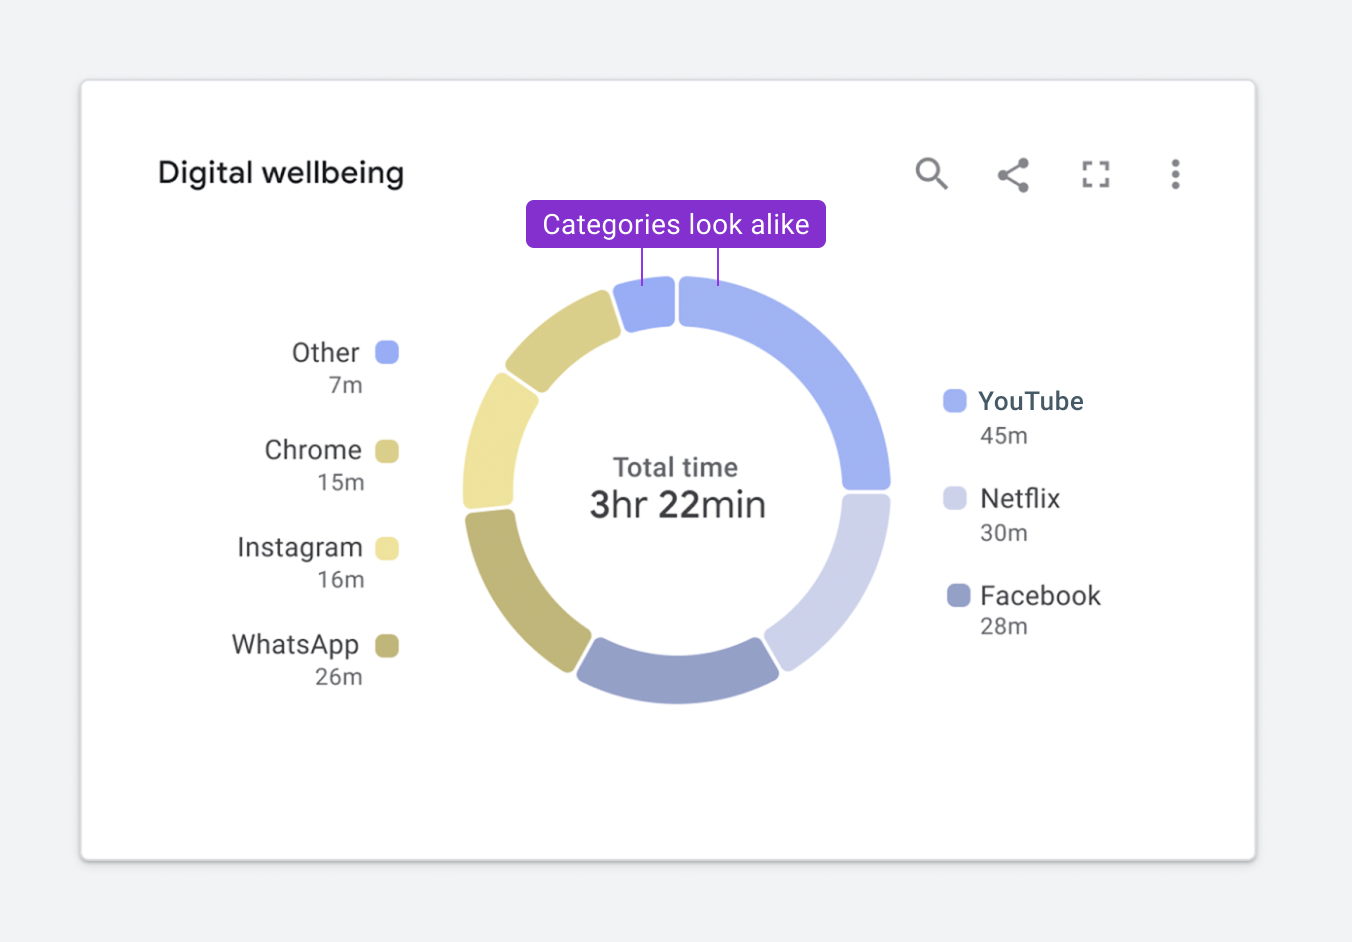
Figure 1.3 highlights how this same chart will appear to someone with a protanopia condition. You’ll notice that it is slightly less readable because the Other and YouTube categories appearing at the top of the donut are indistinguishable from one another.

For someone with achromatopsia, the chart will appear as it does in Figure 1.4

In this case, I’d argue that the chart isn’t really telling us anything. It’s nearly impossible to read, and swapping it out for a data table would be arguably more useful. At this point, you might be wondering how to fix this. Where should you start?

Start With Web Standards

Web standards can help us improve our design. In this case, Web Content Accessibility Guidelines (WCAG) will provide the most comprehensive set of requirements to start with. Guidelines call for two considerations. First, all colors must achieve the proper contrast ratio with their neighboring elements. Second, visualizations need to use something other than color to convey meaning. This can be accomplished by including a second encoding or adding text, images, icons, or patterns. While this article focuses on achieving WCAG 2.1 standards, the same concepts can be used to achieve WCAG 2.2 standards.

Web Standards Challenges

Meeting the web standards is trickier than it might first seem. Let’s dive into a few examples showing how difficult it is to ensure data will be understood at a glance while meeting the standards.

Challenge 1: Color Contrast

According to the WCAG 2.1 (level AA) standards, graphics such as chart elements (lines, bars, areas, nodes, edges, links, and so on) should all achieve a minimum 3:1 contrast ratio with their neighboring elements. Neighboring elements may include other chart elements, interaction states, and the chart’s background. Incidentally, if you’re not sure your colors are achieving the correct minimum ratio, you can check your palette here. Additionally, all text elements should achieve a minimum 4.5:1 contrast ratio with their background. Figure 1.5 depicts a sample categorical color palette that follows the recommended standards.

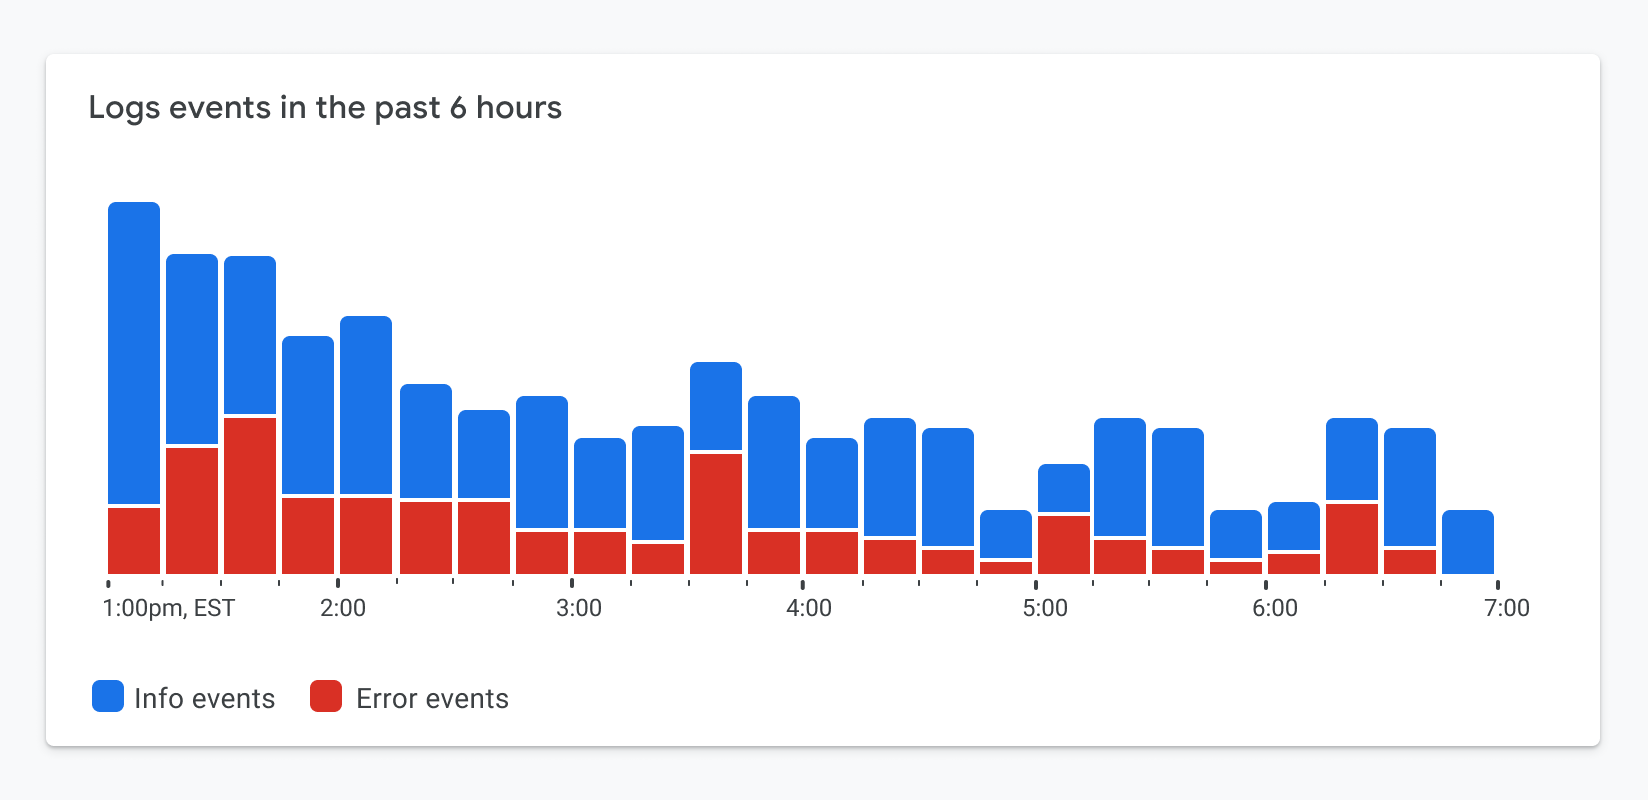
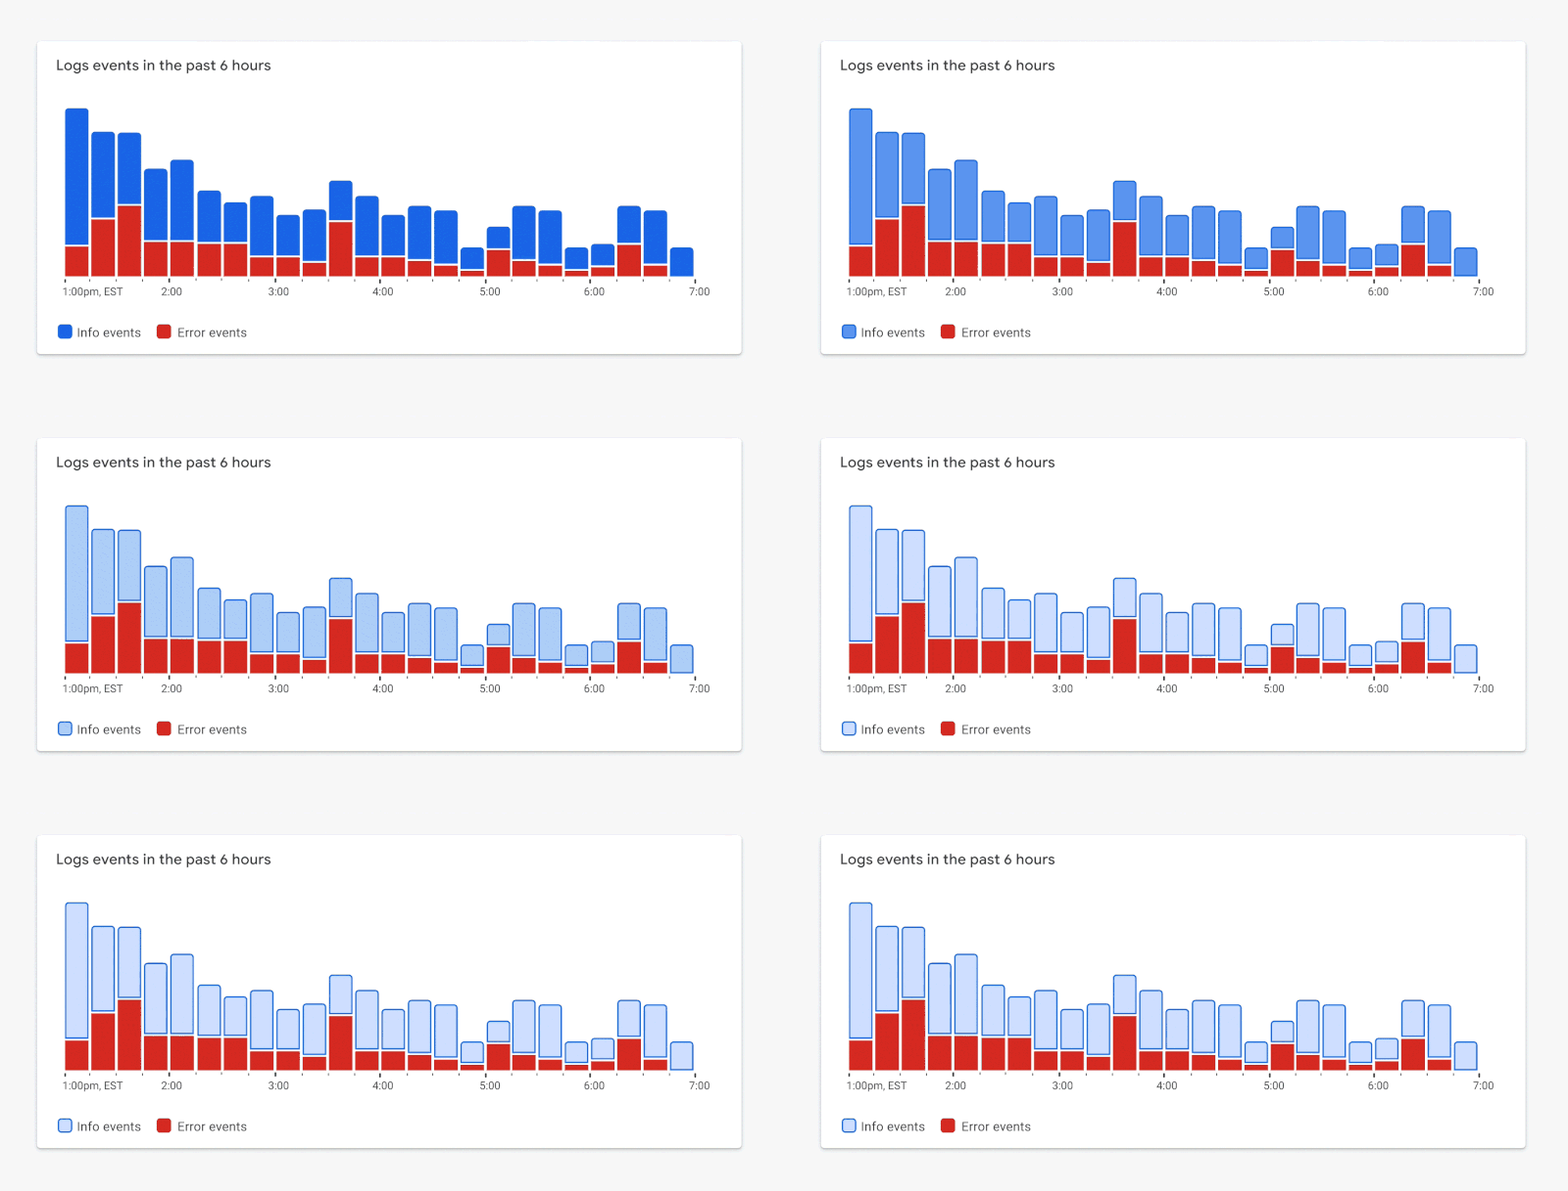
This is quite a bold palette. When applying a compliant palette to a chart, it might look like the example in Figure 1.6.

While this example meets the color contrast requirements, there’s a tradeoff. The chart’s focal point is now lost. The red segments at the bottom of each stacked bar represent the most important metrics illustrated in this chart. They represent errors or a count of items that need your attention. Since the chart features bold colors, all of which are equally competing for our attention, it’s now more difficult to see the items that matter most.

Challenge 2: Dual Encodings, Or Conveying Meaning Without Color

To minimize reliance on color to convey meaning, WCAG 2.1 (level A) standards also call for the use of something other than color to convey meaning. This may be a pattern, texture, icon, text overlay, or an entirely different visual encoding.

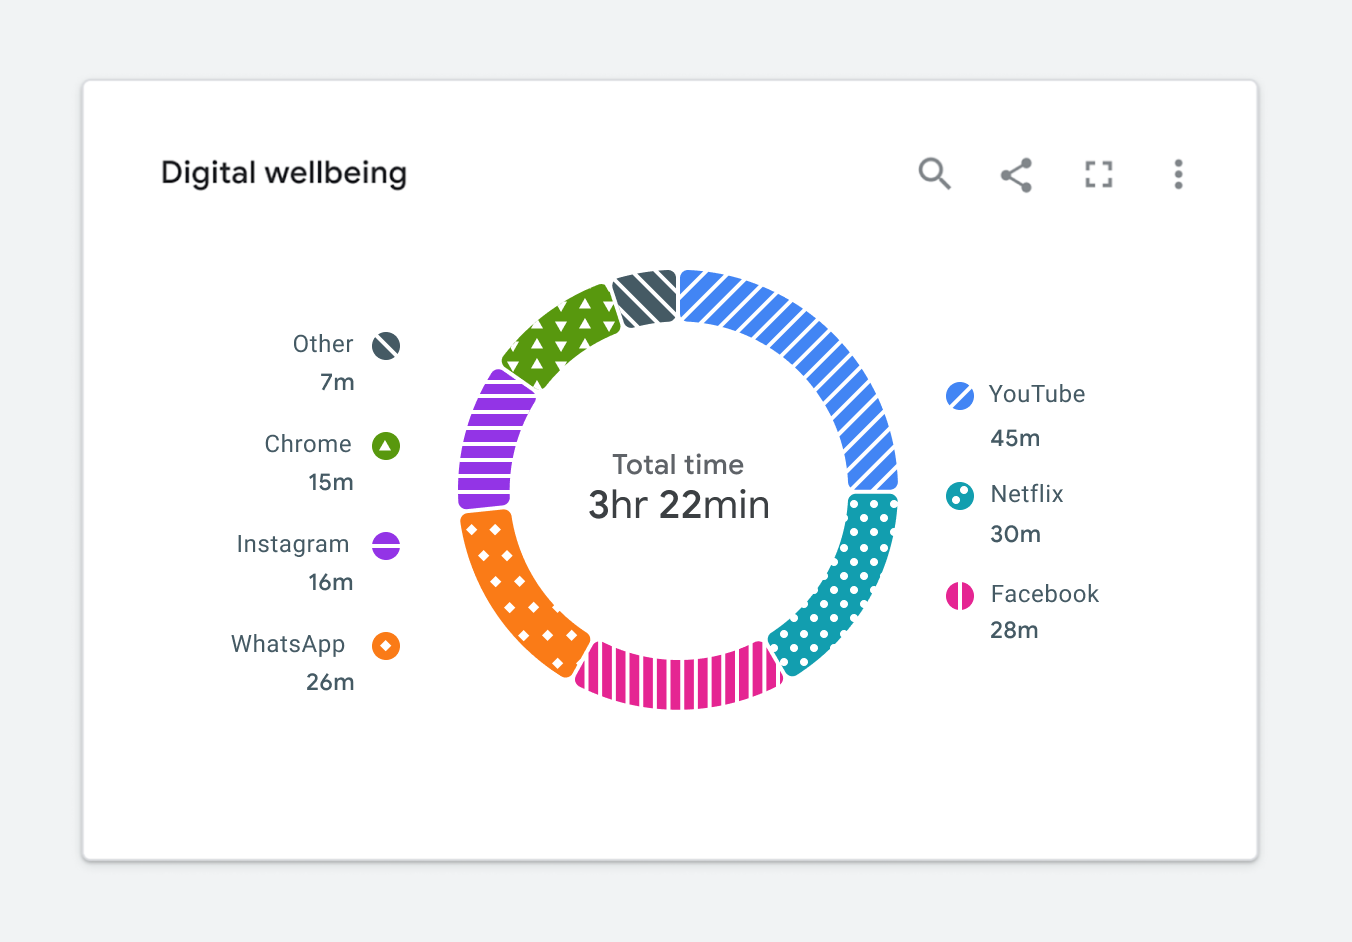
It’s easy to throw a pattern on top of a categorical fill color and call it a day, as illustrated in Figure 1.7. But is the chart still readable? Is it glanceable? In this case, the segments appear to run into one another. In his book, The Visual Display of Quantitative Information, Edward Tufte describes the importance of minimizing chartjunk or unnecessary visual design elements that limit one’s ability to read the chart. This begs the question, do the WCAG standards encourage us to add unnecessary chartjunk to the visualization?

Following the standards verbatim can lead us down the path of creating a really noisy visualization.

Let The Standards Empower vs Constrain Design

Over the past several years, my working group at Google has learned that it’s easier to meet the WCAG visual design requirements when they’re considered at the beginning of the design process instead of trying to update existing charts to meet the standard. The latter approach leads to charts with unnecessary chart junk, just like the one previously depicted in Figure 1.7, and minimized usability. Considering accessibility first will enable you to create a visualization that’s not only accessible but useful. We’re calling this our accessibility-first approach to chart design. Now, let’s see some examples.

Solving For Color Contrast

Let’s revisit the color contrast requirement via the example in Figure 1.8. In this case, the most important metric is represented by the red segments appearing at the bottom of each bar in the series. The red color represents a count of items in a failing state. Since both colors in this palette compete for our attention, it’s difficult to focus on the metric that matters most. The chart is no longer glanceable.

Focus On Essential Elements Only

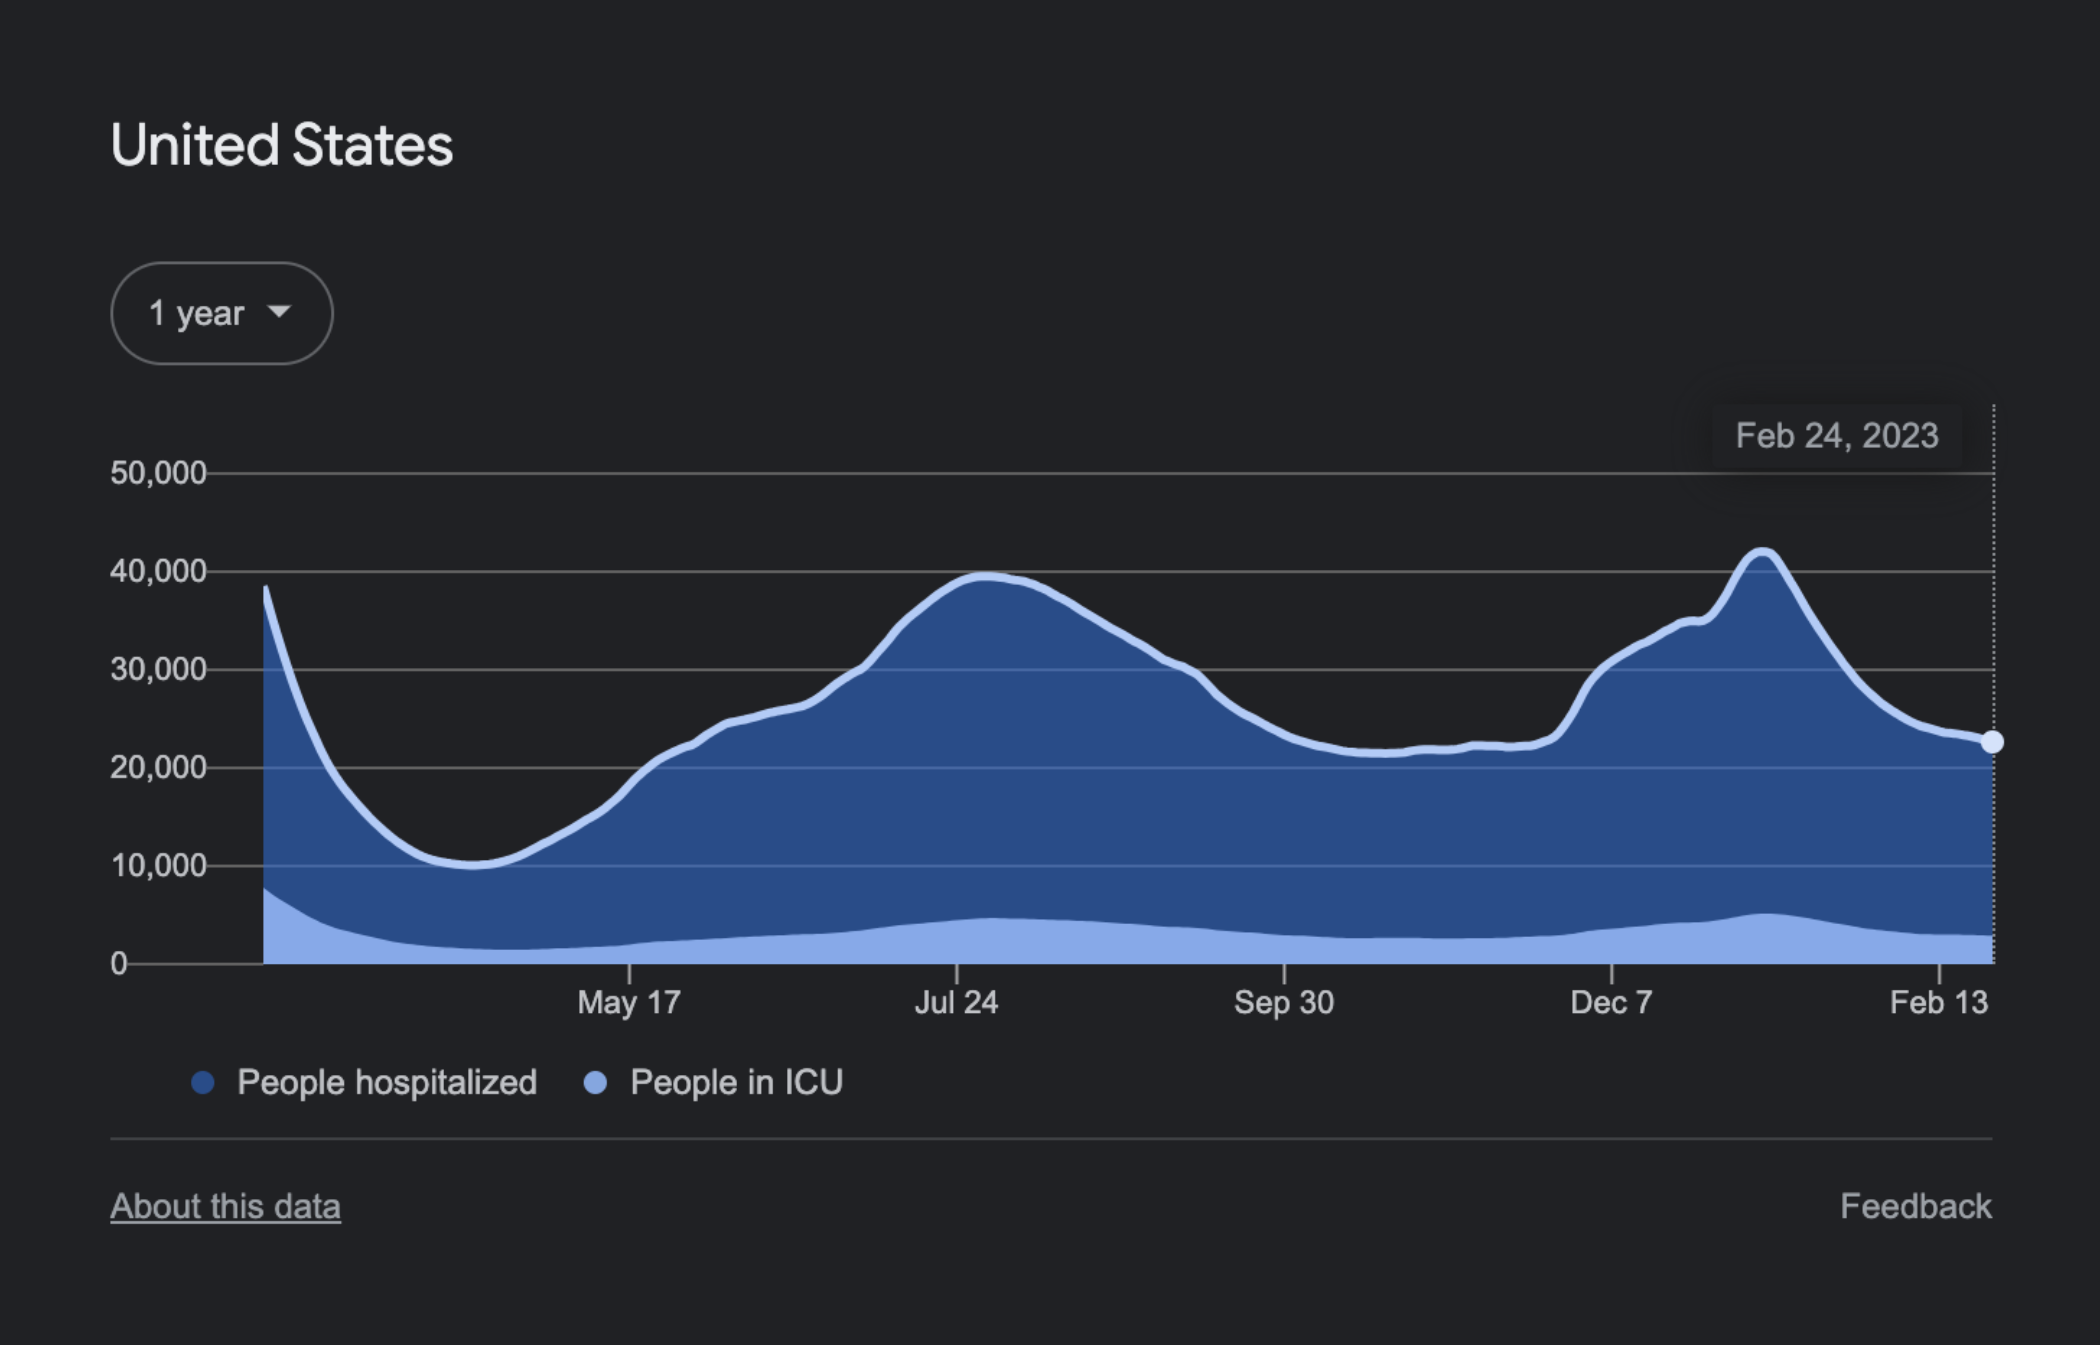
By stretching the standards a bit, we can balance a11y and glanceability a lot better. Only the visual elements essential for interpreting the visualization need to achieve the color contrast requirement. In the case of Figure 1.8, we can use borders that achieve the required contrast ratio while using lighter fills to the point of focus. In Figure 1.9, you’ll notice your attention now shifts down to the metrics that matter most.

Figure 1.9. ✅ DO: Consider using a combination of outlines and fills to meet contrast requirements while maintaining a focal point. (Large preview)
Dark Themes For The Win

Most designers I know love a good dark theme like the one used in Figure 2.0. It looks nice, and dark themes often result in visually stunning charts.

More importantly, a dark theme offers an accessibility advantage. When building on top of a dark background, we can use a wider array of color shades that will still achieve the minimum required contrast ratio.

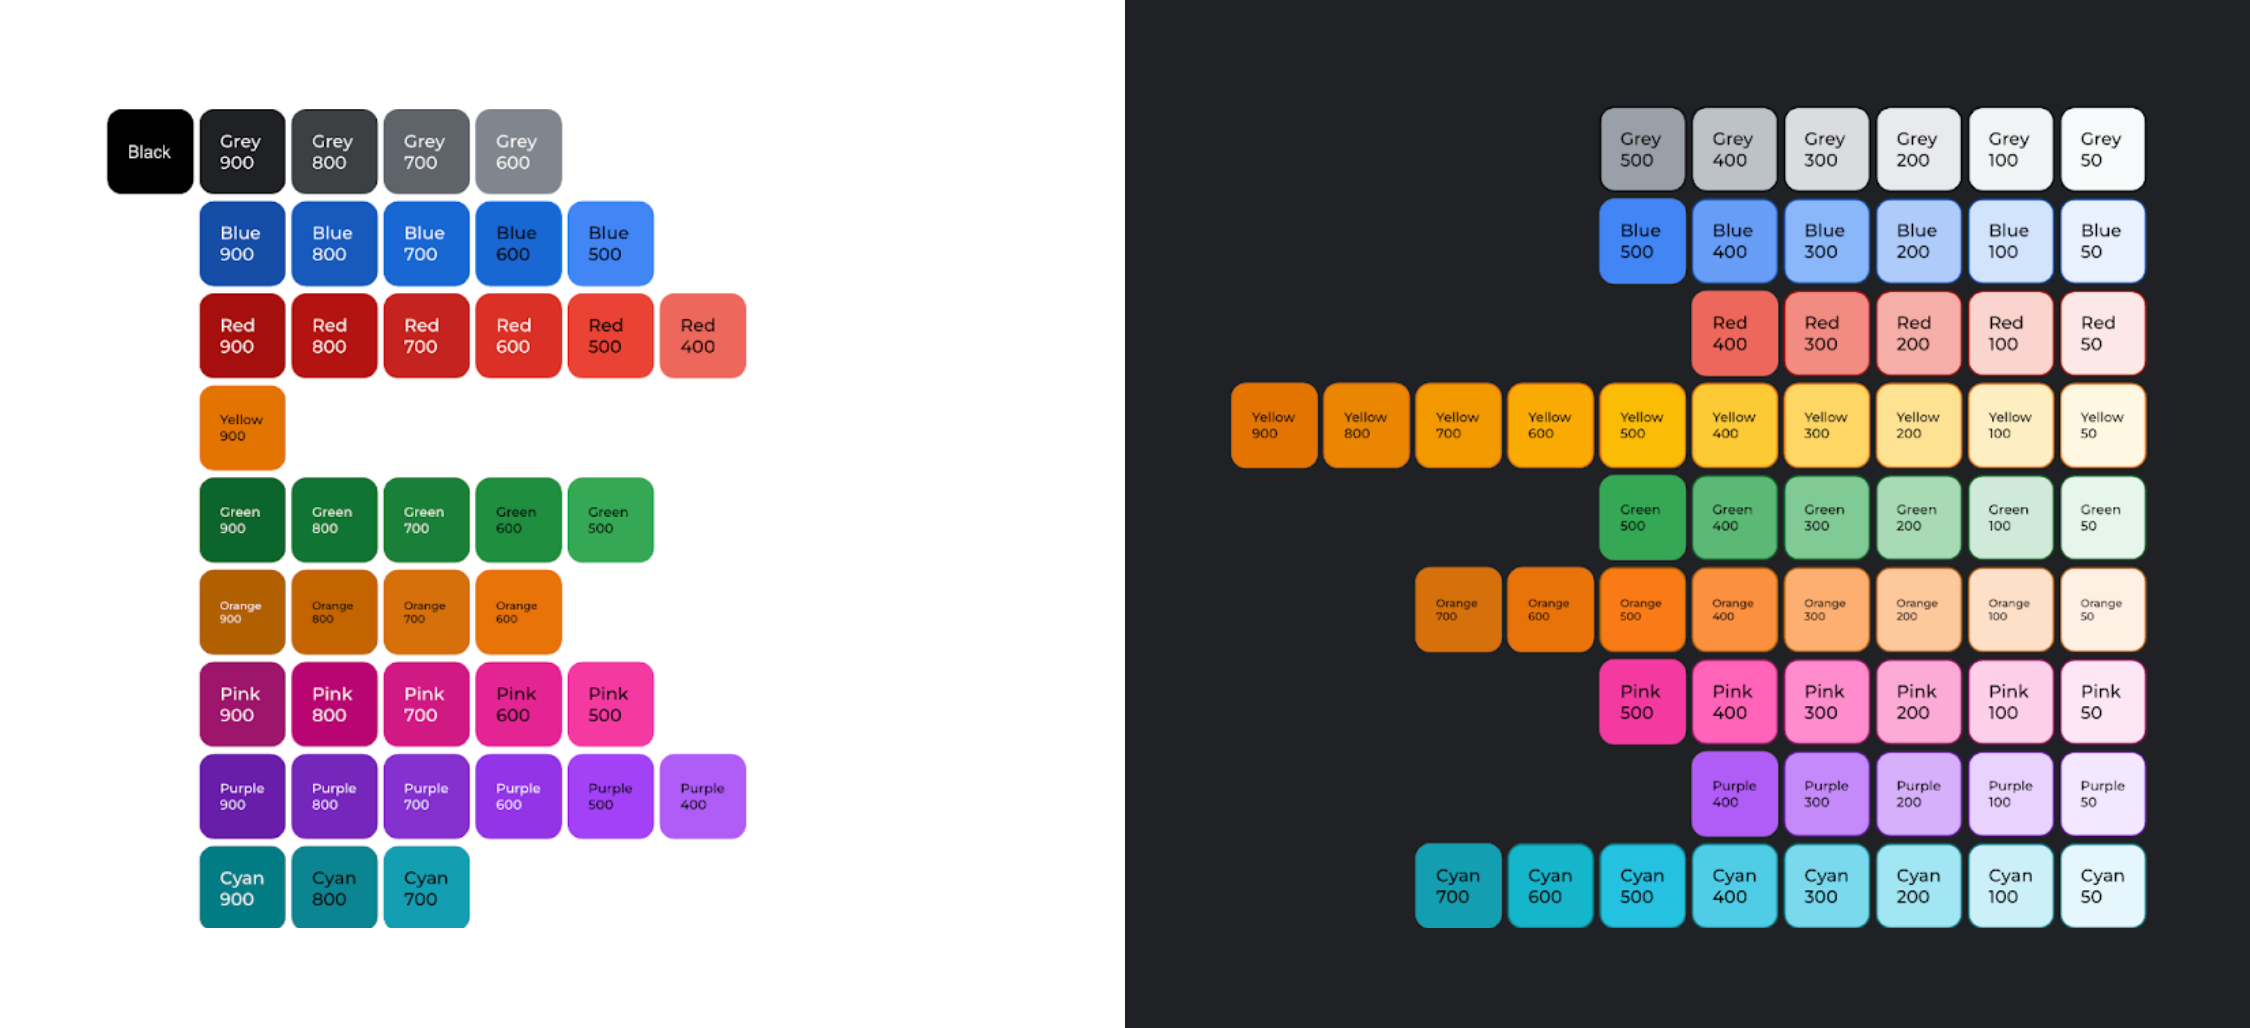
According to an audit conducted by Google’s Data Accessibility Working Group, the 61 shades of the Google Material palette from 2018 achieved the minimum 3:1 contrast ratio when placed on a dark background. This is depicted in Figure 2.1. Only 40 shades of Google Material colors achieved the same contrast ratio when placed on a white background. The 50% increase in available shades when moving from a light background to a dark background makes a huge difference. Having access to more shades enables us to draw focus to items that matter most.

With this in mind, let’s revisit the earlier donut chart example in Figure 2.2. For now, let’s keep the white background, as it’s a core part of Google’s brand.

Figure 2.2. ✅ DO: Use a combination of fills and borders that achieve the minimum contrast ratios to improve the readability of your chart. (Large preview)
While this is a great first step, there’s still more work to do. Let’s take a closer look.

Solving For Dual Encodings And Minimizing Chartjunk

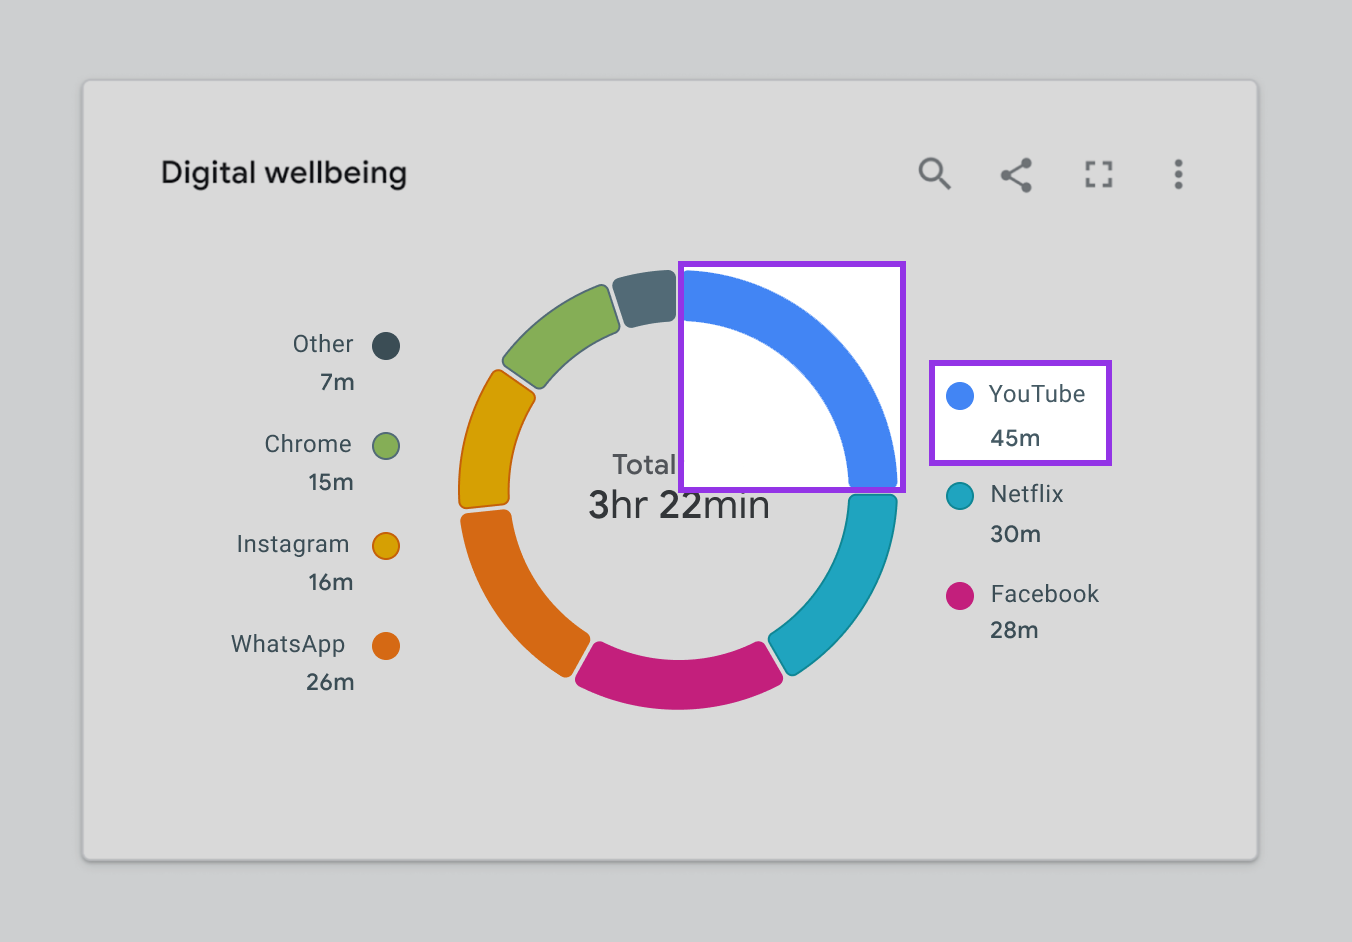
As shown in Figure 2.3, color is our only way of connecting segments in the donut to the corresponding categories in the legend. Despite our best efforts to follow color contrast standards, the chart can still be difficult to read for people with certain vision disabilities. We need a dual encoding, or something other than color, to convey meaning.

How might we do this without adding noise or reducing the chart’s readability or glanceability? Let’s start with the text.

Integrating Text And Icons

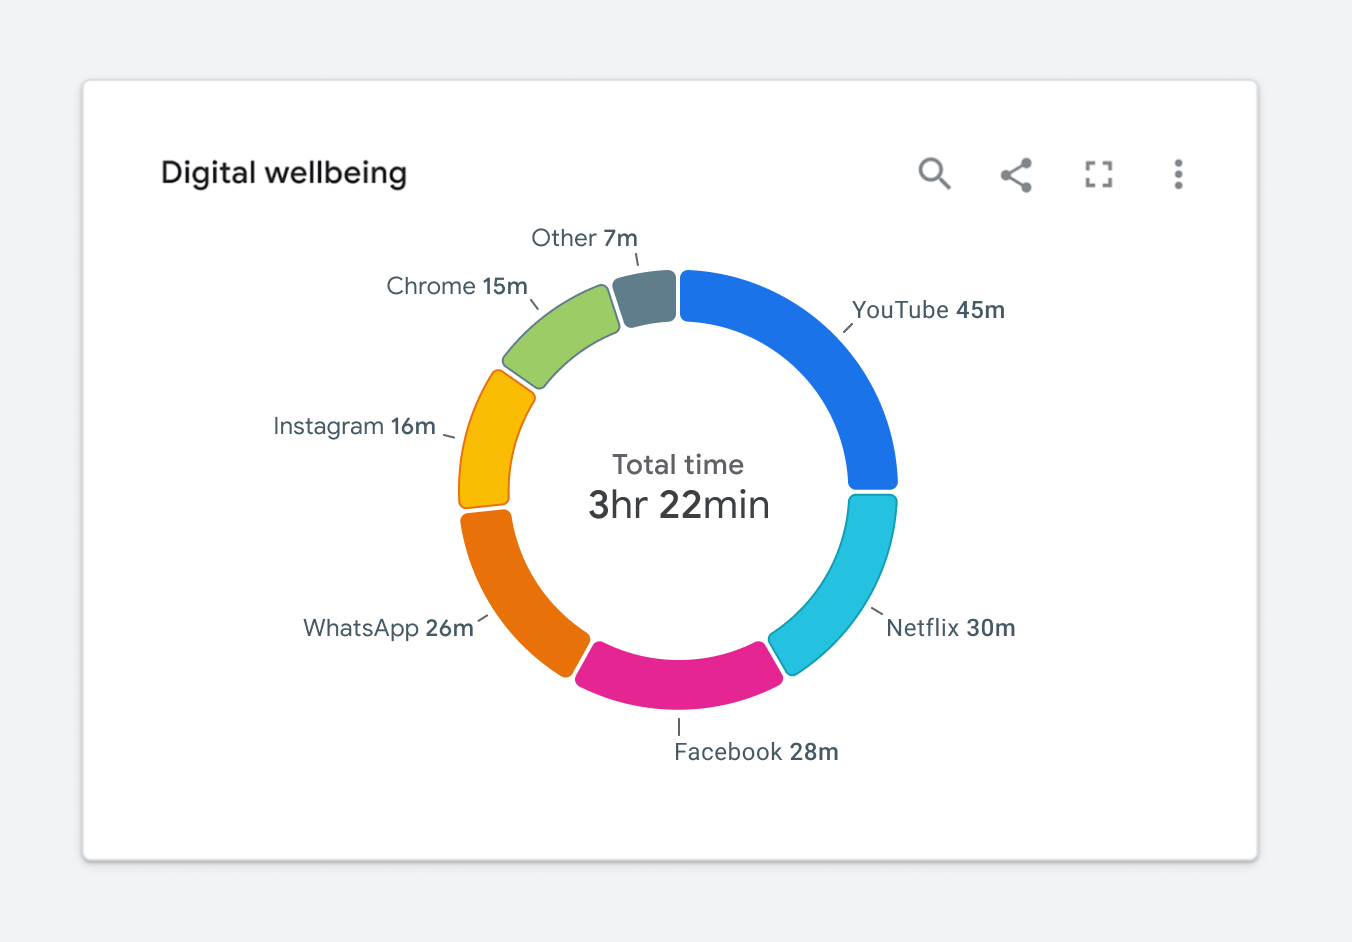
Adding text to a visualization is a great way to solve the dual encoding problem. Let’s use our donut chart as an example. If we move the legend labels into the graph, as illustrated in Figure 2.4, we can visually connect them to their corresponding segments. As a result, there is no longer a need for a legend, and the labels become the second encoding.

Let’s look at a few other ways to provide a dual encoding while maximizing readability. This will prevent us from running in the direction of applying unnecessary chart junk like the example previously highlighted in Figure 1.7.

Depending on the situation, shape of the data, or the available screen real estate, we may not have the luxury of overlaying text on top of a visualization. In cases like in Figure 2.5, it’s still okay to use iconography. For example, if we’re dealing with a very limited number of categories, the added iconography can still act as a dual encoding.

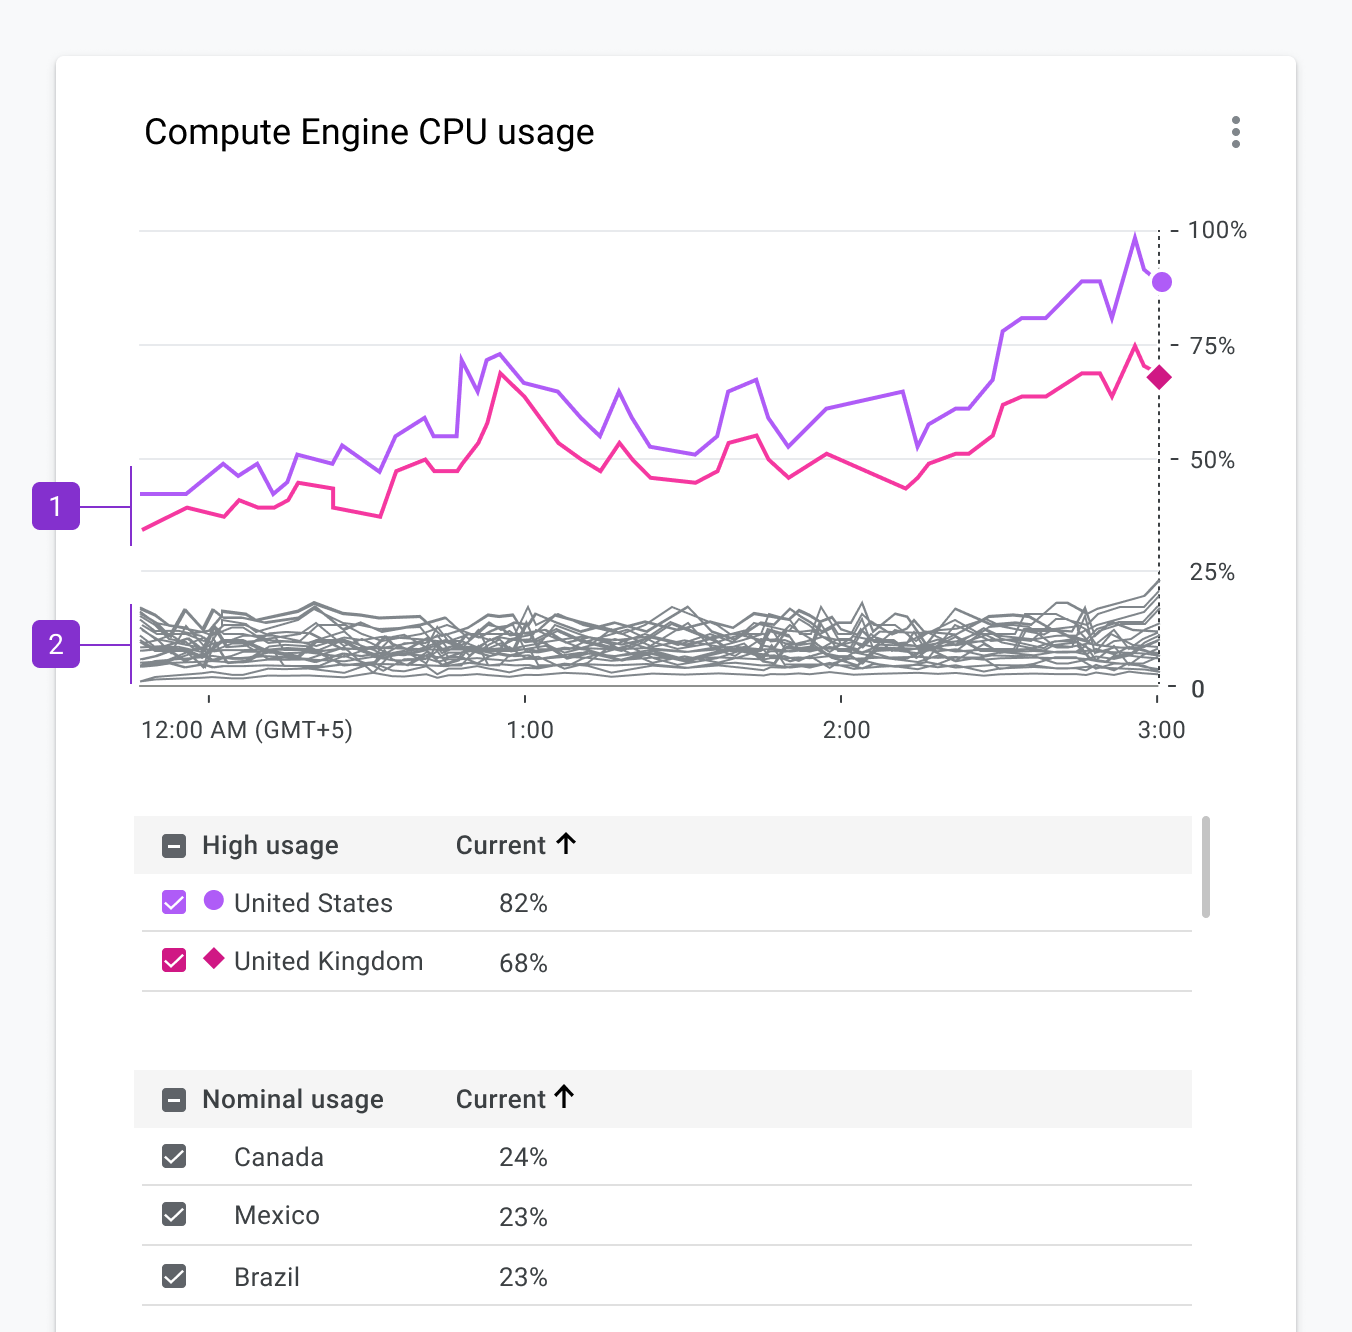
Some charts can have upwards of hundreds of categories, which makes it difficult to add iconography or text. In these cases, we must revisit the purpose of the chart and decide if we need to differentiate categories. Perhaps color, along with a dual encoding, can be used to highlight other aspects of the data. The example in Figure 2.6 shows a line chart with hundreds of categories.

We did a few things with color to convey meaning here:

Bright colors are used to depict outliers within the data set.
A neutral gray color is applied to all nominal categories.

In this scenario, we can once again use a very limited set of shapes for differentiating specific categories.

The Benefits Of Small Multiples And Sparklines

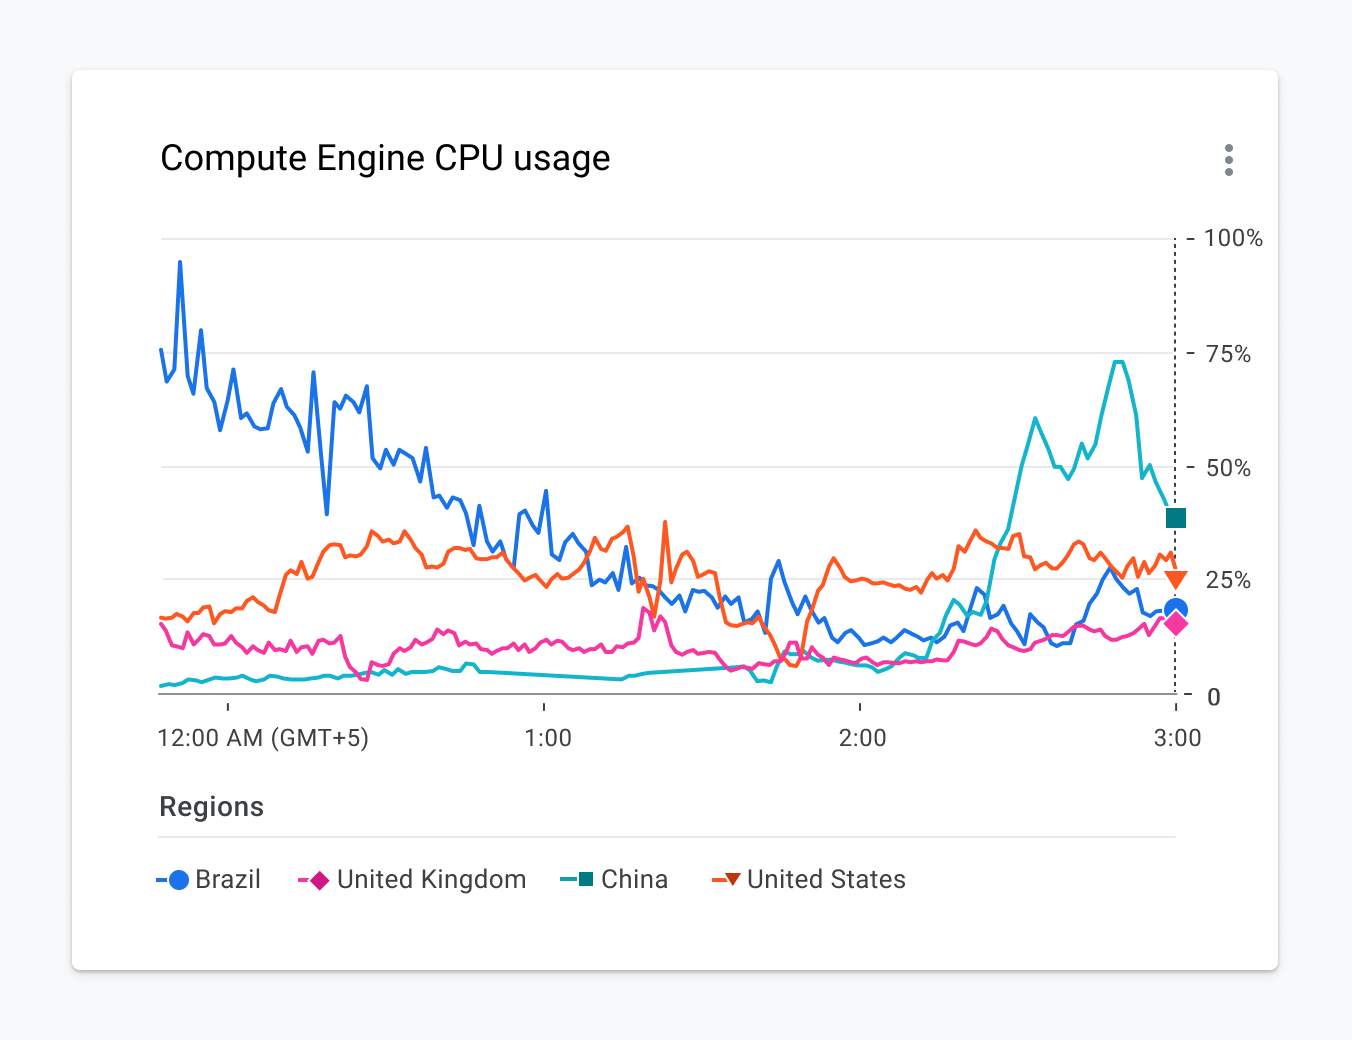
There are still times when it’s important to differentiate between all categories depicted in a visualization. For example, the tangled mess of a chart is depicted in Figure 2.7.

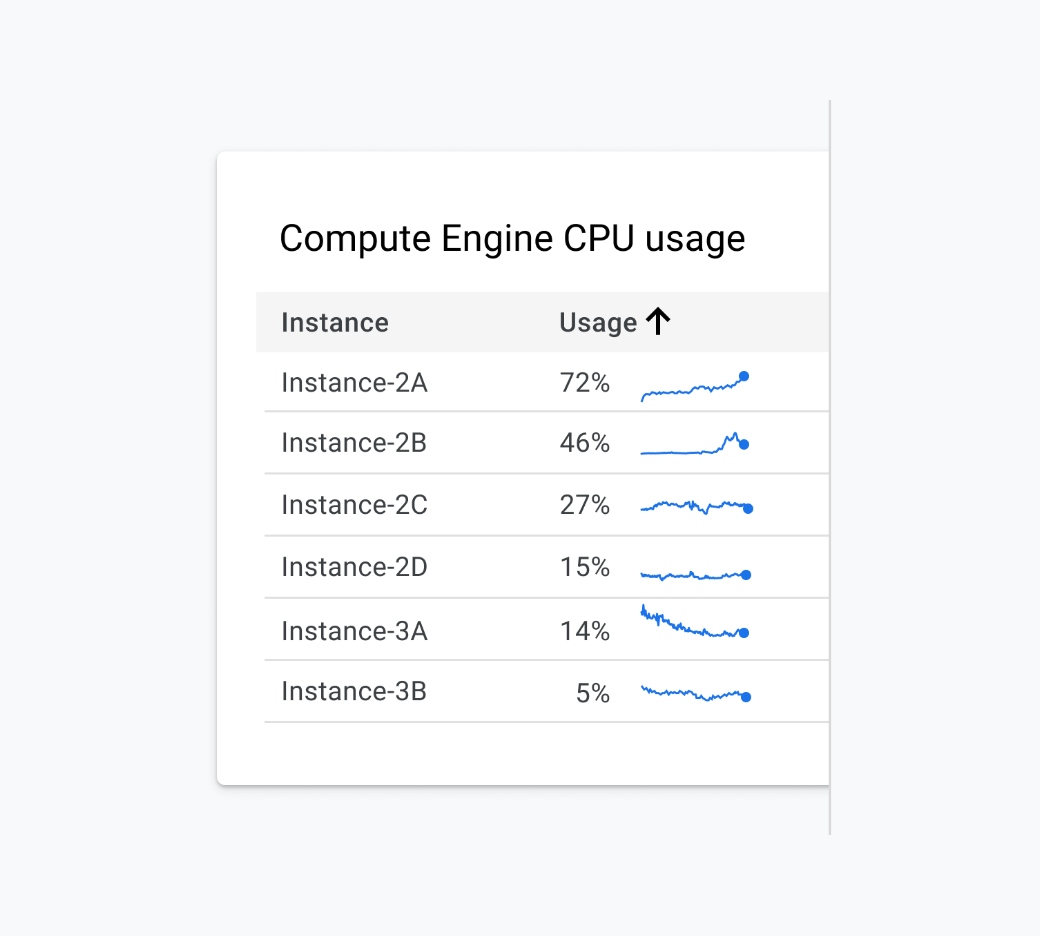
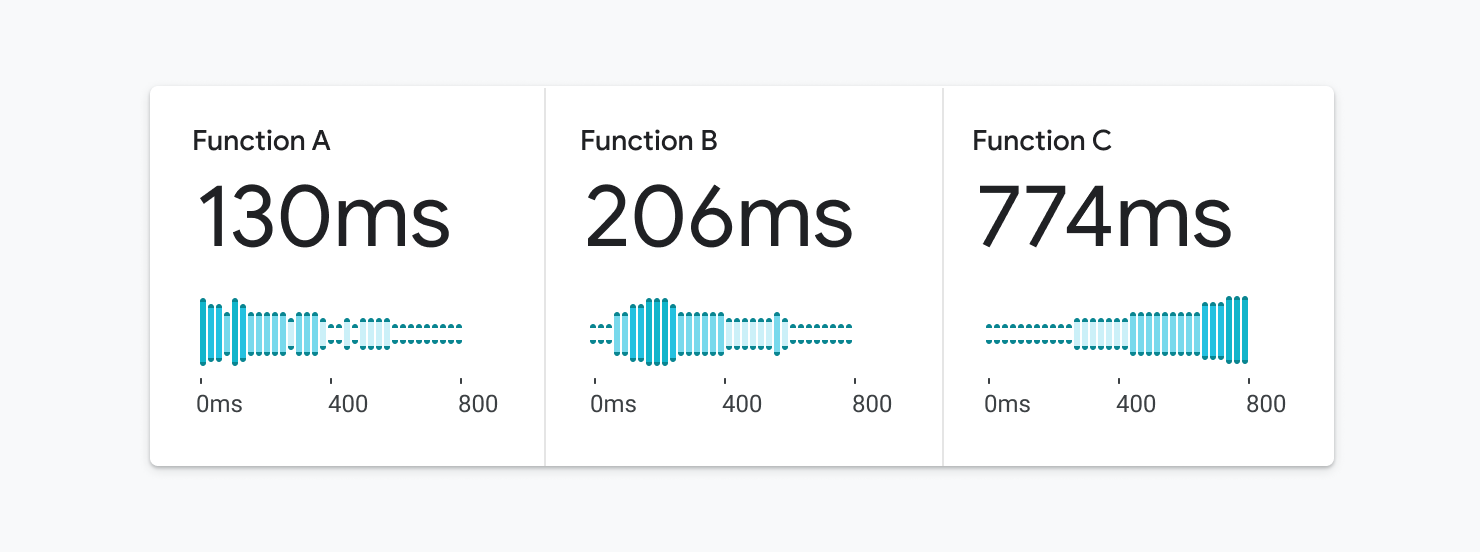
In this case, a more accessible solution would include breaking the charts into their own mini charts or sparklines, as depicted in Figure 2.8. This solution is arguably better for everyone because it makes it easier to see the individual trend for each category. It’s more accessible because we’ve completely removed the reliance on color and appended text to each of the mincharts, which is better for the screen reader experience.

Reserve Fills For Items That Need Your Attention

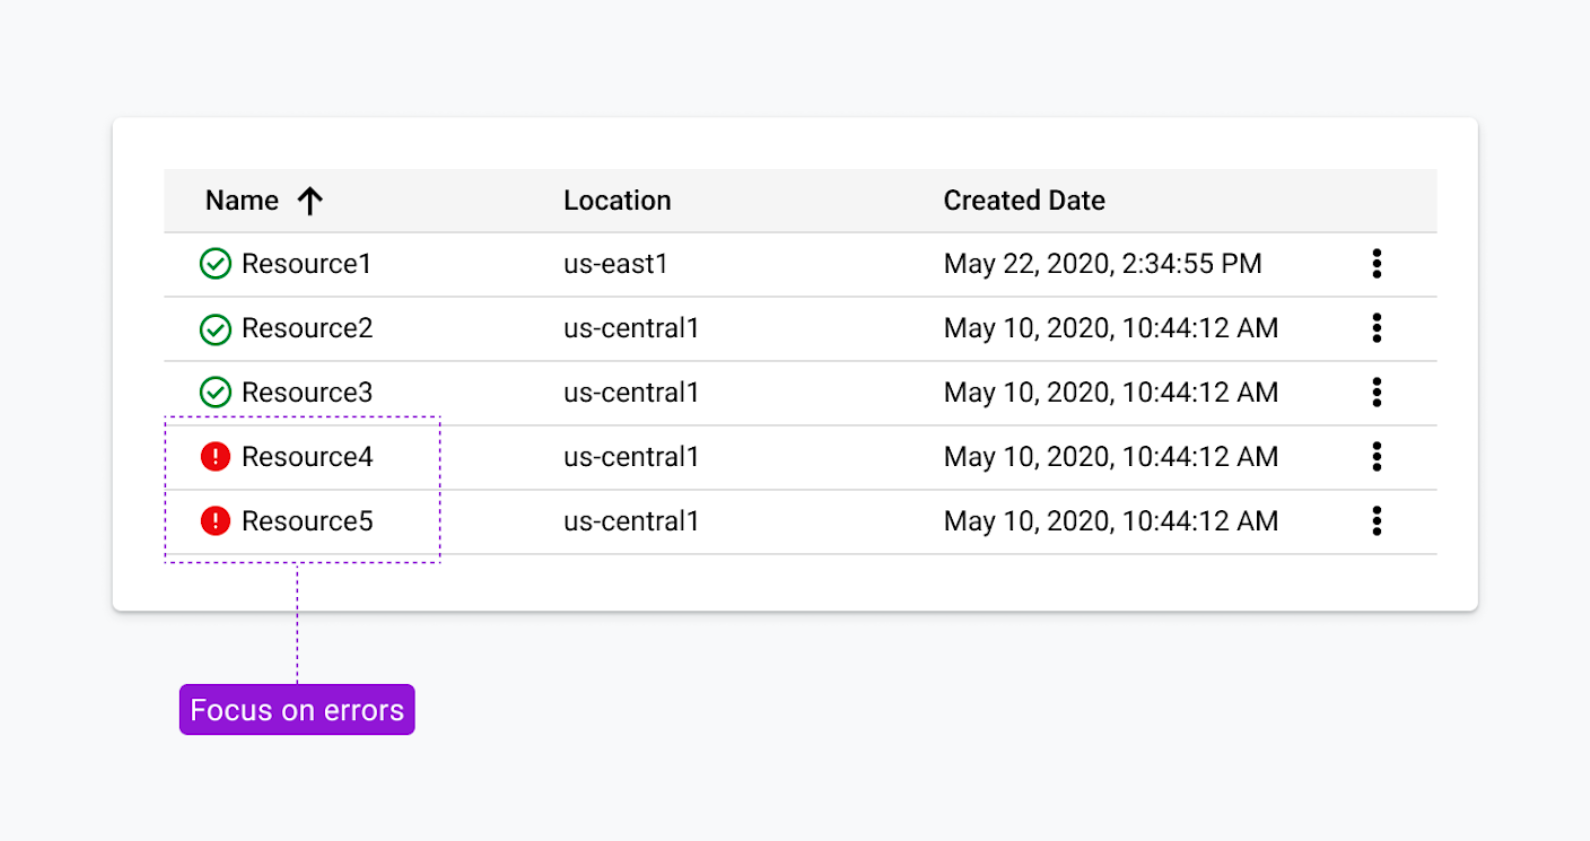
Earlier, we examined using a combination of fills and outlines to achieve color contrast requirements. Red and green are commonly used to convey status. For someone who is red/green colorblind, this can be very problematic. As an alternative, the status icons in Figure 2.9 reserve fills for the items that need your attention. We co-designed this solution with some help from customers who are colorblind. It’s arguably more scannable for people who are fully sighted, too.

Embracing Relevant Metaphors

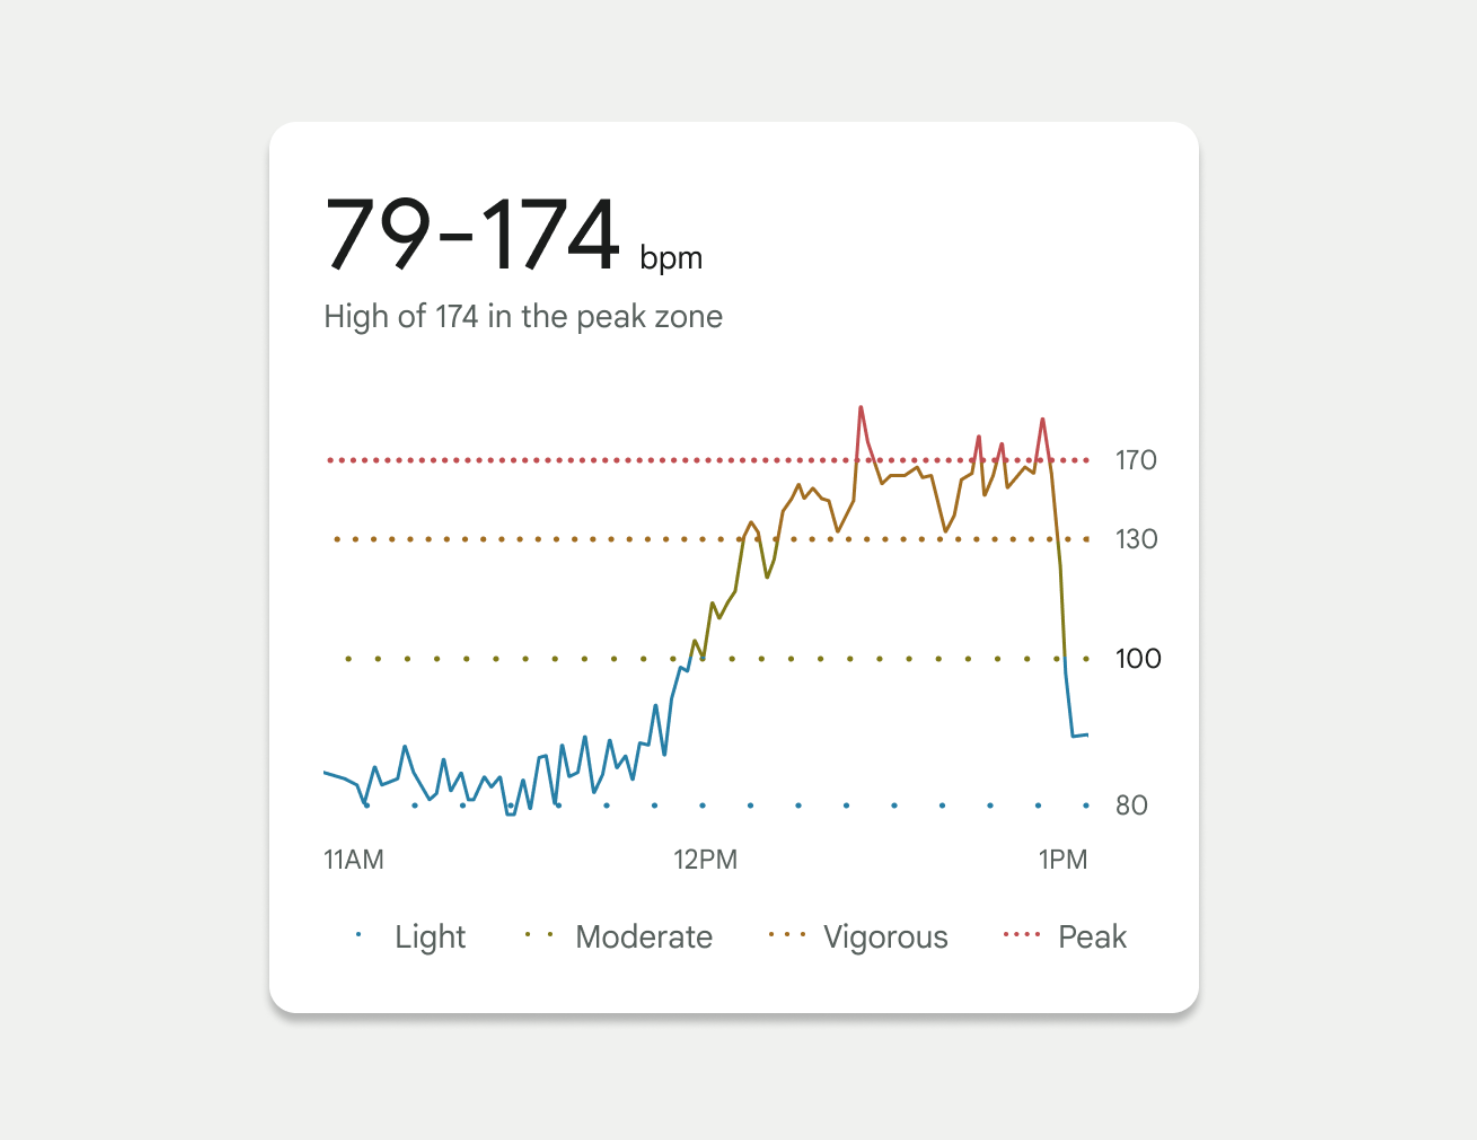
In 2022, we launched a redesigned Fitbit mobile app for the masses. One of my favorite visualizations from this launch is a chart showing your heart rate throughout the day. As depicted in Figure 3.0, this chart shows when your heart rate crosses into different zones. Dotted lines were used to depict each of these zone thresholds. We used the spacing between the dots as our dual encoding, which invokes a feeling of a “visual” heartbeat. Threshold lines with closely spaced dots imply a higher heart rate.

Continuing the theme of using fun, relevant metaphors, we even based our threshold spacing on the Fibonacci Sequence. This enabled us to represent each threshold with a noticeably different visual treatment. For this example, we knew we were on the right track as these accessibility considerations tested well with people who have color-deficient vision.

Accessible Interaction States

Color contrast and encodings also need to be considered when showing interactions like mouse hover, selection, and keyboard focus, like the examples in Figure 3.1. The same rules apply here. In this example, the hover, focus, and clicked state of each bar is delineated by elements that appear above and below the bar. As a result, these elements only need to achieve a 3:1 contrast ratio with the white background and not the bars themselves. Not only did this pattern test well in multiple usability studies, but it was also designed so that the states could overlap. For example, the hover state and selected state can appear simultaneously and still meet accessibility requirements.

Finding Your Inspiration

For some more challenging projects, we’ve taken inspiration from unexpected areas.

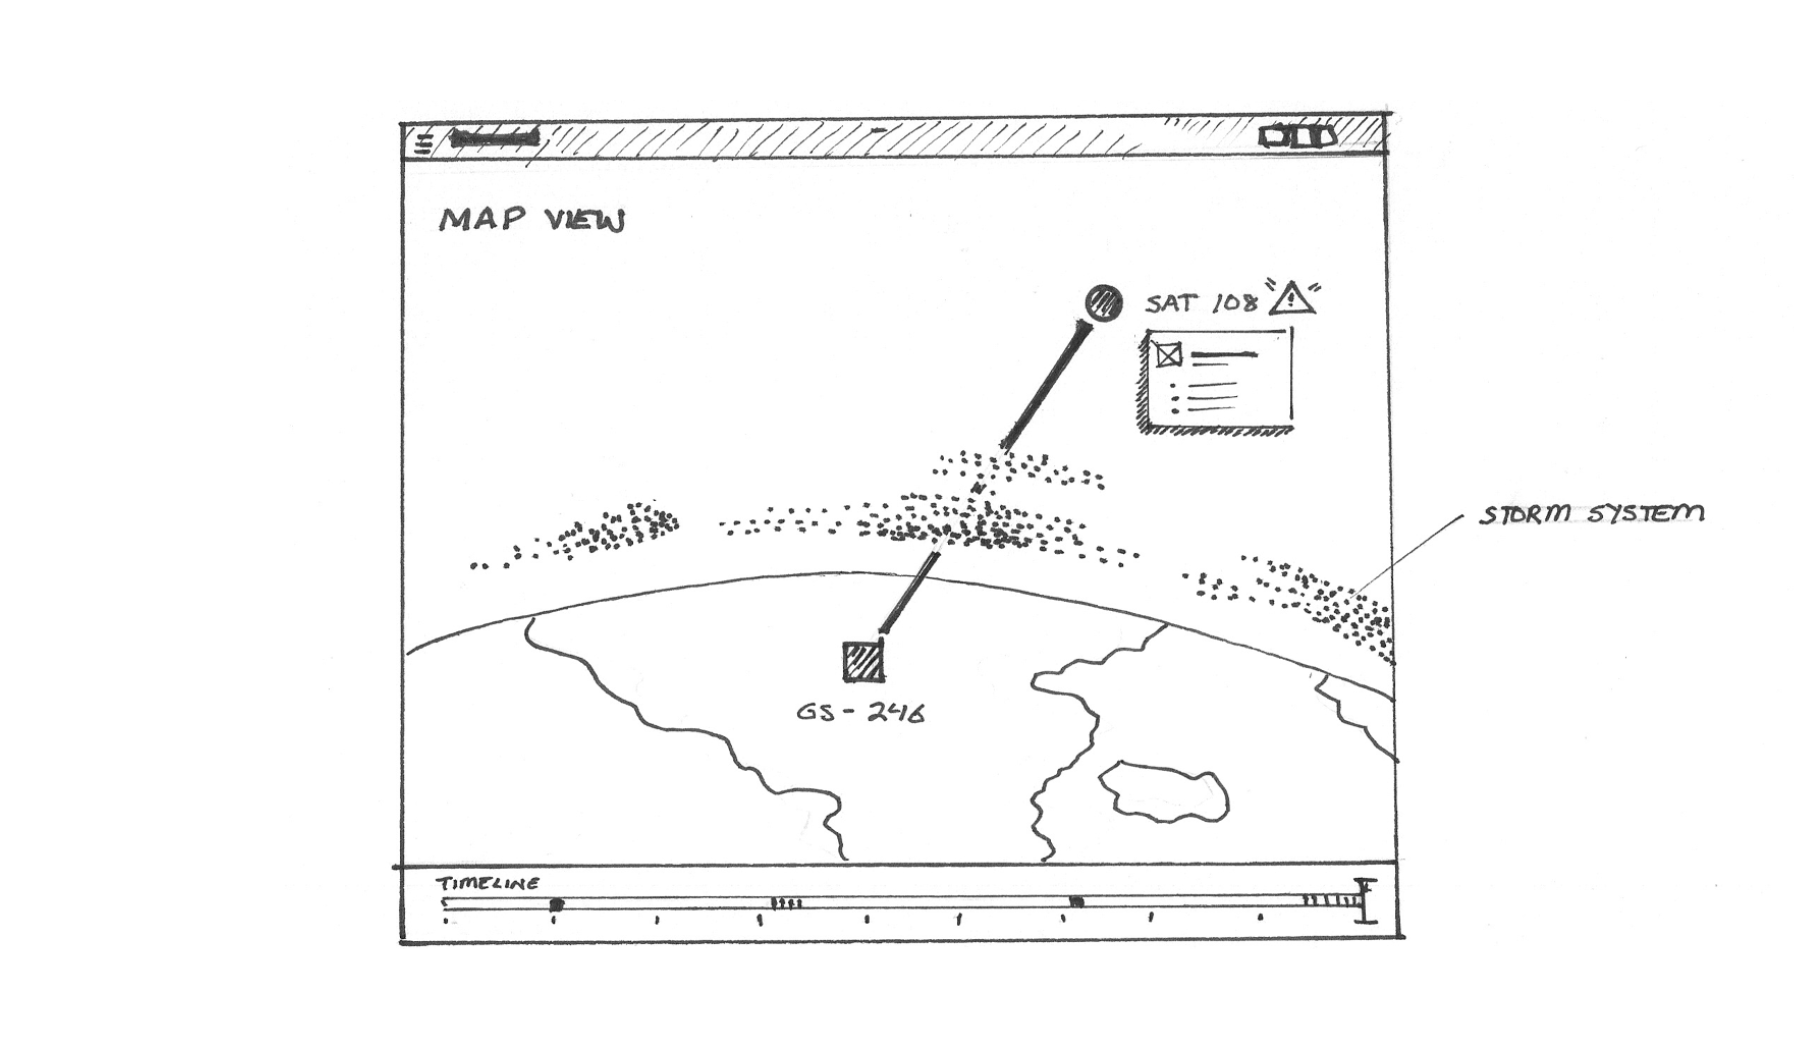
For example, we looked to nature (Figure 3.2) to help us consider methods for visualizing the effects of cloud moisture on an LTE network, as sketched in Figure 3.3.

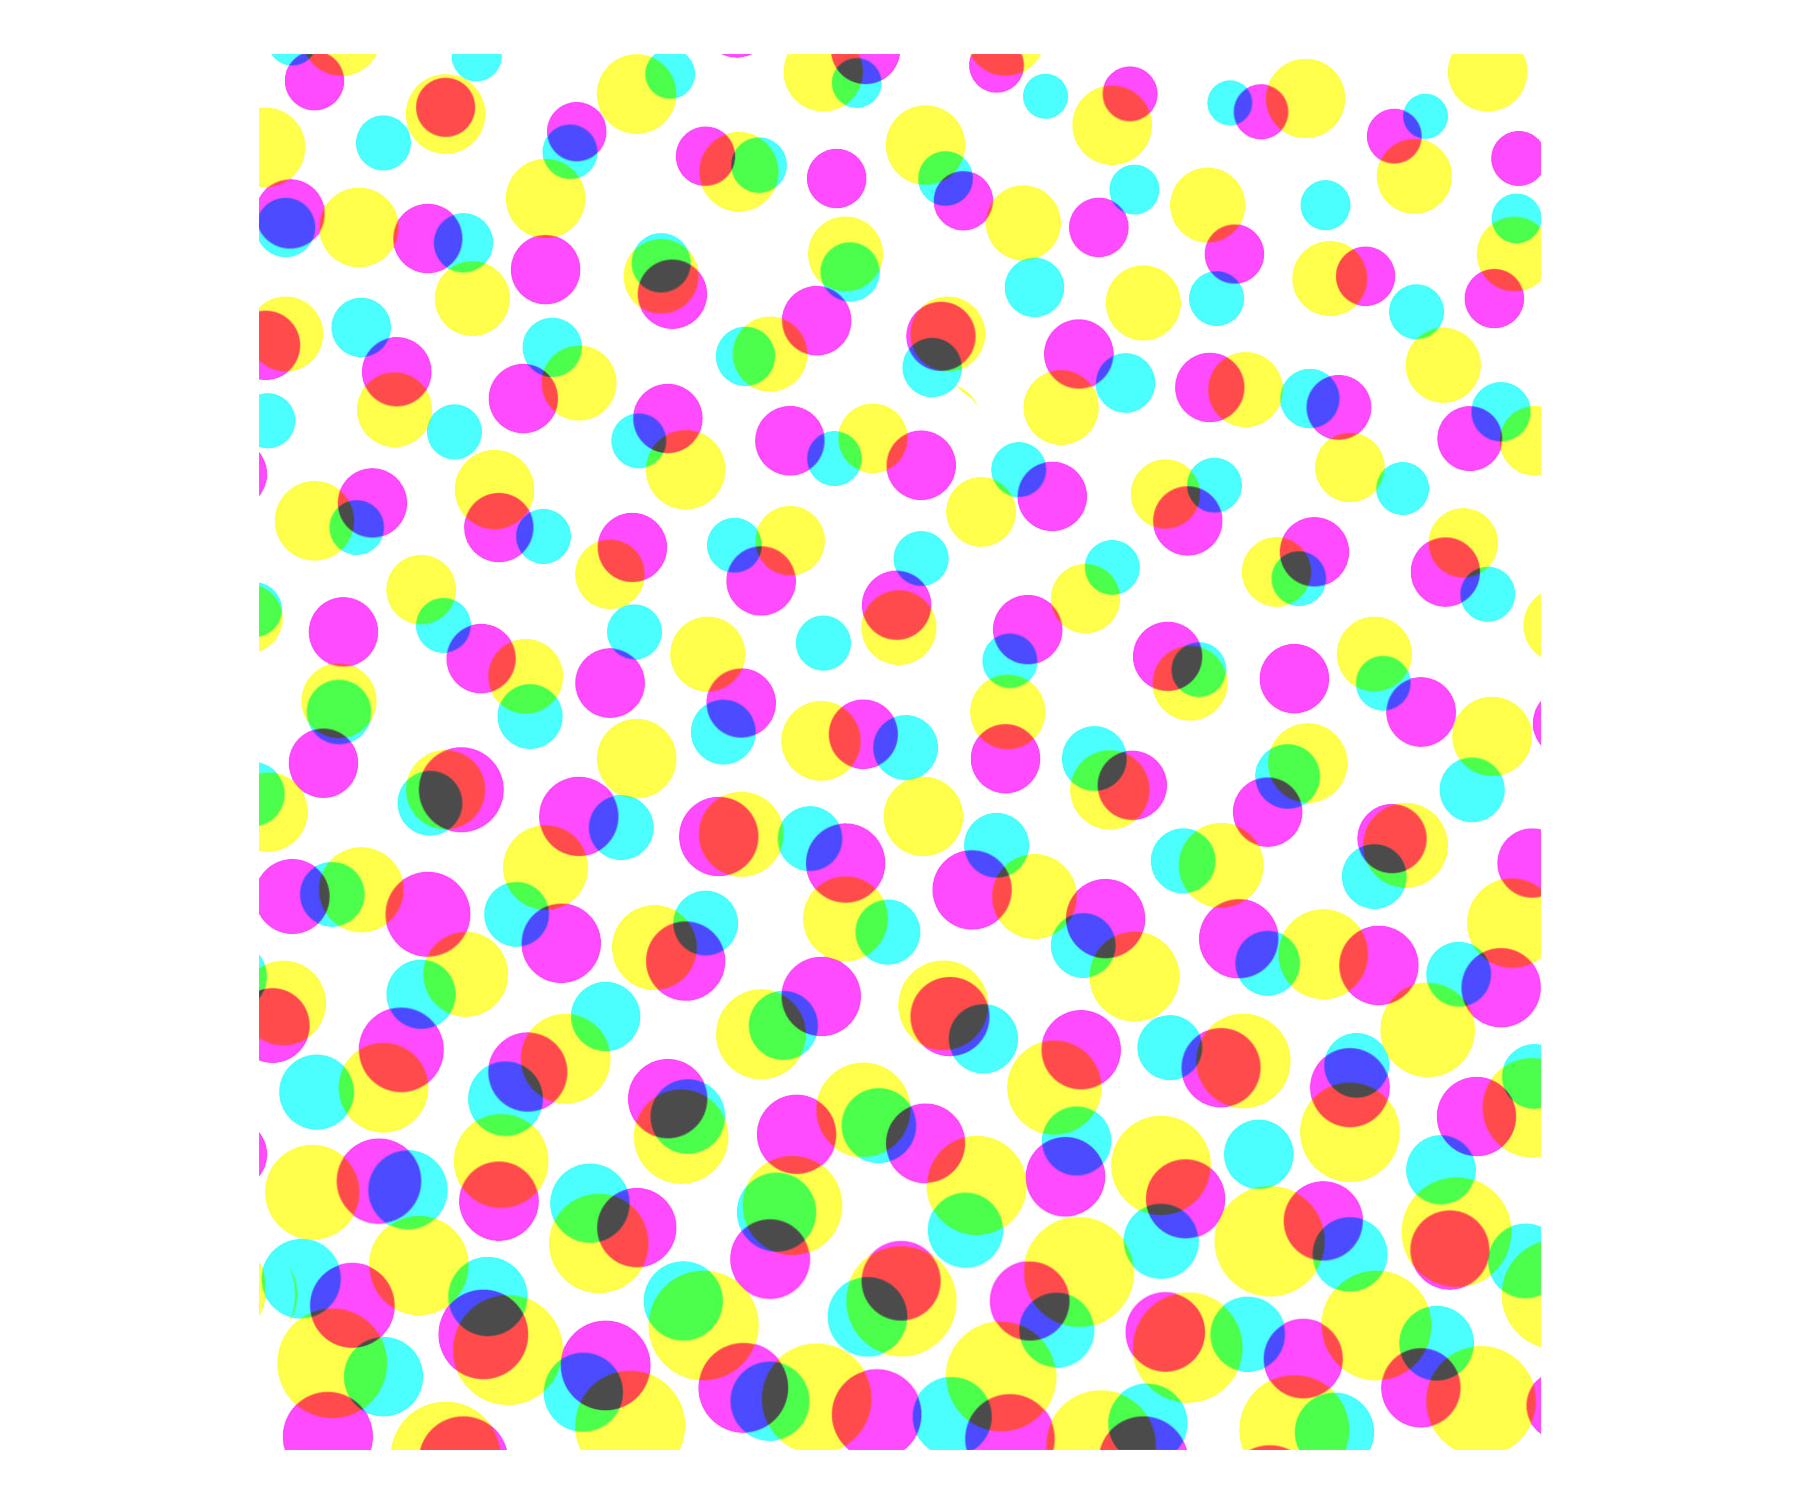
We’ve taken inspiration from halftone printing processes (Figure 3.4) to think about how we might reimagine a heatmap with a dual encoding, as depicted in Figure 3.5.

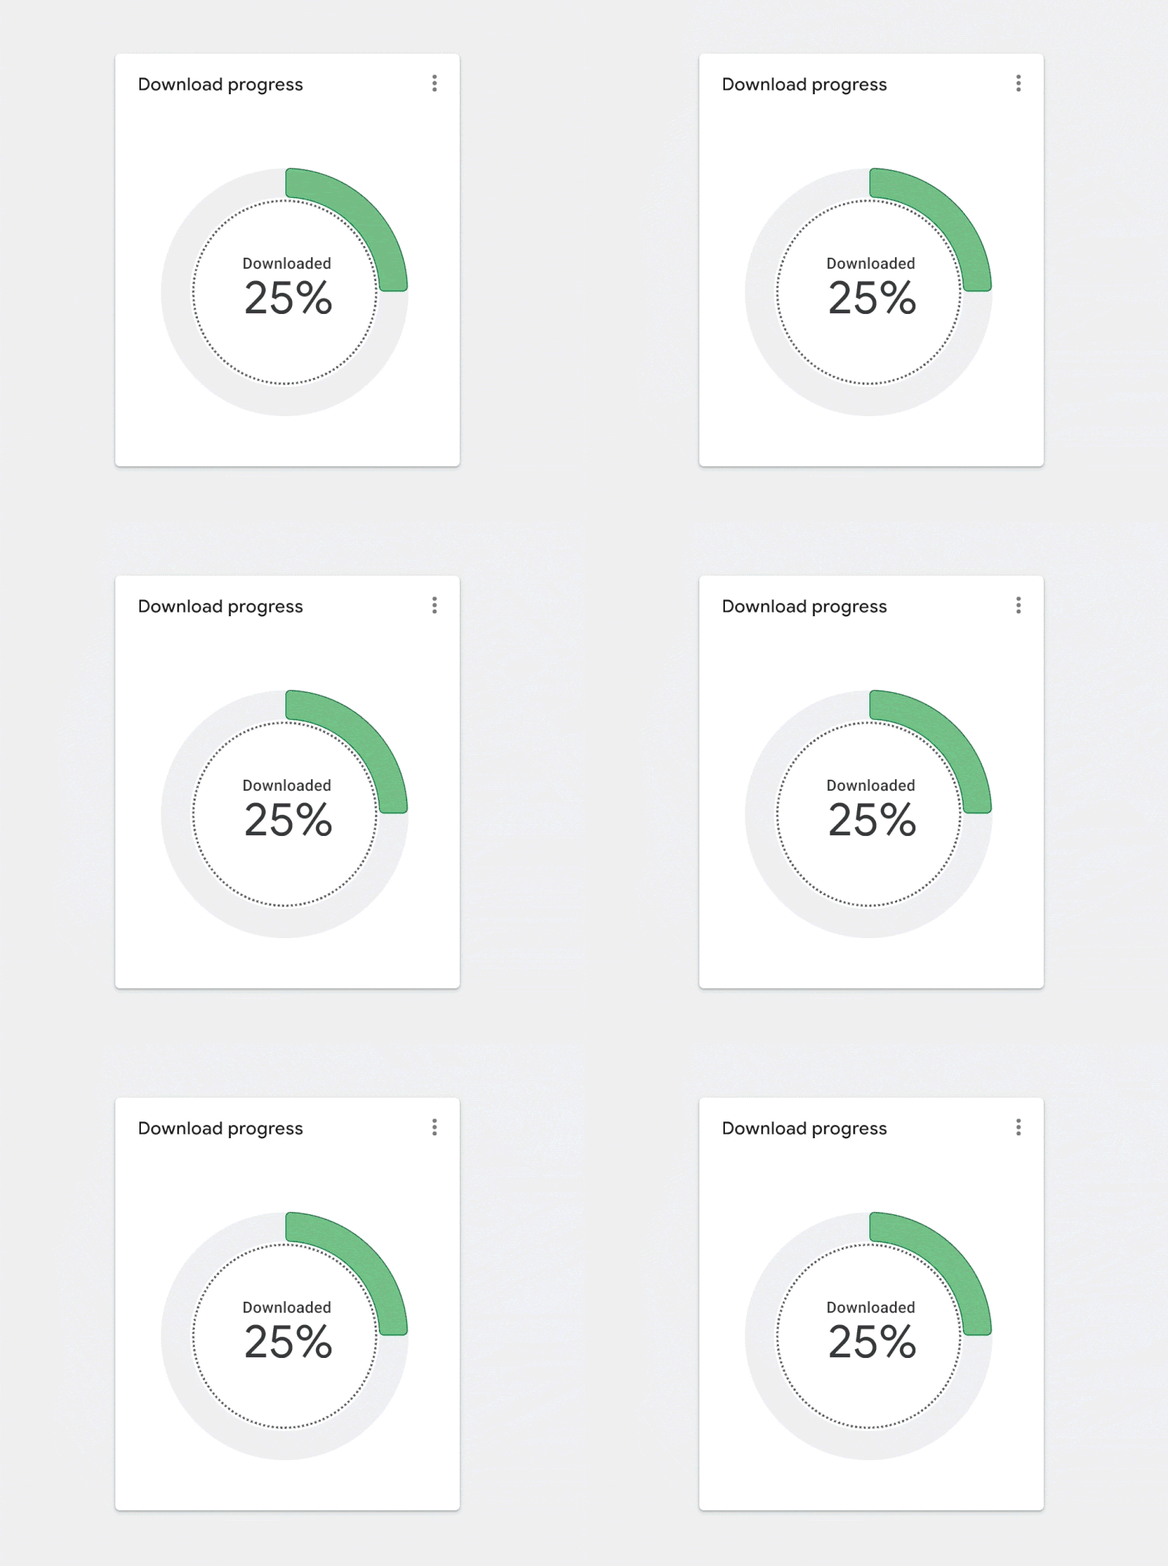
We’ve also taken inspiration from architecture and how people move through buildings (Figure 3.6) to consider methods for showing the scope and flow of data into a donut chart as depicted in Figure 3.7.

Figure 3.7. Applying inspiration from architecture and a building’s flow. (Large preview)
In this case, the animated inner ring highlights the scope of the donut chart when it’s empty and indicates that it will fill up to 100%. Animation is a great technique, but it presents other accessibility challenges and should either time out or have a stop control.

In some cases, we were even inspired to explore new versions of existing visualization types, like the one depicted in Figure 3.8. This case study highlights a step-by-step guide to how we landed on this example.

Getting People On Board With Accessibility

One key lesson is that it’s important to get colleagues on board with accessibility as soon as possible. Your compliant designs may not look quite as pretty as your non-compliant designs and may be open to criticism.

So, how can you get your colleagues on board? For starters, evangelism is key. Provide examples like the ones included here, which can help your colleagues build empathy for people with vision disabilities. Find moments to share the work with your company’s leadership team, spreading awareness. Team meetings, design critiques, AMA sessions, organization forums, and all-hands are a good start. Oftentimes, colleagues may not fully understand how accessibility requirements apply to charting or how their visualizations are used by people with disabilities.

While share-outs are a great start, communication is one way. We found that it’s easier to build momentum when you invite others to participate in the design process. Invite them into brainstorming meetings, design reviews, codesign sessions, and the problem space to help them appreciate how difficult these challenges are. Enlist their help, too.

By engaging with colleagues, we were able to pinpoint our champions within the group or those people who were so passionate about the topic they were willing to spend extra time building demos, prototypes, design specs, and research repositories. For example, at Google, we were able to publish our Top Tips for Data Accessibility on the Material Design blog.

Aside from good citizenship and building a grassroots start, there are ways to get the business on board. Pointing to regulations like Section 508 in America and the European Accessibility Act are other good ways to encourage your business to dive deeper into your product’s accessibility. It’s also an effective mechanism for getting funding and ensuring accessibility is on your product’s roadmap. Once you’ve made the business case and you’ve identified the accessibility champions on your team, it’s time to start designing.

Conclusion

Accessibility is more than compliance. Accessibility considerations can and will benefit everyone, so it’s important not to shove them into a special menu or mode or forget about them until the end of the design process. When you consider accessibility from the start, the WCAG standards also suddenly seem a lot less constraining than when you try to retrofit existing charts for accessibility.

The examples here were built over the course of 3 years, and they’re based on valuable lessons learned along the way. My hope is that you can use the tested designs in this article to get a head start. And by taking an accessibility-first approach, you’ll end up with overall better data visualizations — ones that fully take into account how all people gather, accumulate, and process information.

Resources

To get started thinking about data accessibility, check out some of these resources:

Getting started

Google’s Top Tips for Data Accessibility
Color and contrast
A comprehensive guide for exploring and learning about the theory, science, and perception of color and contrast.
Introduction to accessible contrast and color for data visualization
A series of Observable notebooks on using contrast and patterns to distinguish marks in accessible data visualizations.

ACM

Color blind accessibility manifesto

Contrast checking tool

Contrast-Ratio.com

WCAG requirements

Guidelines for text contrast contrast
Guidelines for graphic color contrast

Material design best practices and specs

Accessibility with Material 3
“Google’s Six Principles for Designing Any Chart,” Manuel Lima
Data Visualization in Material Design

We’re incredibly proud of our colleagues who contributed to the research and examples featured in this article. This includes Andrew Carter, Ben Wong, Chris Calo, Gerard Rocha, Ian Hill, Jenifer Kozenski Devins, Jennifer Reilly, Kai Chang, Lisa Kaggen, Mags Sosa, Nicholas Cottrell, Rebecca Plotnick, Roshini Kumar, Sierra Seeborn, and Tyler Williamson. Without everyone’s contributions, we wouldn’t have been able to advance our knowledge of accessible chart visual design.

Iconic Go.Compare mascot gets a playful rebrand

Original Source: https://www.creativebloq.com/news/go-compare-rebrand

Love him or hate him, Gio’s here to stay.

Milaq Branding & Visual Identity Design Insights

Original Source: https://abduzeedo.com/milaq-branding-visual-identity-design-insights

Milaq Branding & Visual Identity Design Insights

abduzeedo0214—24

Discover how Milaq’s visual identity and branding, crafted by Iliass Sabouny, sets new standards in the ride-hailing industry, emphasizing innovation, reliability, and user focus.

In the competitive landscape of ride-hailing services, standing out requires more than just efficient logistics; it demands a compelling brand identity that resonates with users on a deeper level. This is precisely where the Milaq brand, through the creative genius of Iliass Sabouny, shines brightly, showcasing a masterclass in branding and visual identity.

Milaq’s journey began with a clear mission: to transcend traditional transportation services and offer a seamless, enjoyable experience to its users. Sabouny’s approach to crafting the visual identity for Milaq was rooted in this mission, focusing on innovation, reliability, and customer-centricity. The result is a branding strategy that not only captures the essence of Milaq but also sets it apart in the ride-hailing market.

The logo design, a cornerstone of any branding effort, speaks volumes about Milaq’s ethos. It’s more than a symbol; it’s a promise of quality and a beacon of innovation. Sabouny’s work meticulously bridges the gap between visual appeal and functional design, ensuring the logo encapsulates the forward-thinking vision of Milaq.

The color palette, typography, and imagery chosen for Milaq’s branding further reinforce the brand’s core values. Each element is carefully selected to evoke a sense of reliability and trustworthiness, while also appealing to the modern, tech-savvy consumer. The integration of these design elements creates a cohesive visual narrative that enhances the user’s journey from the moment they engage with the brand.

Sabouny’s design for Milaq is a testament to the power of thoughtful branding. It not only achieves a distinctive look and feel for the brand but also aligns with its strategic objectives, ensuring that every touchpoint with customers reinforces Milaq’s mission. This project exemplifies how effective visual identity and branding can elevate a company within its industry, making it a case study worth exploring for anyone interested in the intersection of design and business strategy.

For designers and brands alike, Milaq’s branding journey offers valuable insights into creating a visual identity that resonates with users and stands the test of time. It underscores the importance of aligning design with a brand’s core values and mission, ensuring that every element of the visual identity contributes to a singular, compelling narrative.

Branding and visual identity artifacts

brand identity branding  Brand Design Advertising  visual identity Logo Design logo Logotype ride hailing ridebrand identity branding  Brand Design Advertising  visual identity Logo Design logo Logotype ride hailing ride

brand identity branding  Brand Design Advertising  visual identity Logo Design logo Logotype ride hailing ride

brand identity branding  Brand Design Advertising  visual identity Logo Design logo Logotype ride hailing ride

brand identity branding  Brand Design Advertising  visual identity Logo Design logo Logotype ride hailing ride

brand identity branding  Brand Design Advertising  visual identity Logo Design logo Logotype ride hailing ride

brand identity branding  Brand Design Advertising  visual identity Logo Design logo Logotype ride hailing ride

brand identity branding  Brand Design Advertising  visual identity Logo Design logo Logotype ride hailing ride


brand identity branding  Brand Design Advertising  visual identity Logo Design logo Logotype ride hailing ride

brand identity branding  Brand Design Advertising  visual identity Logo Design logo Logotype ride hailing ride

brand identity branding  Brand Design Advertising  visual identity Logo Design logo Logotype ride hailing ride


brand identity branding  Brand Design Advertising  visual identity Logo Design logo Logotype ride hailing ride

brand identity branding  Brand Design Advertising  visual identity Logo Design logo Logotype ride hailing ride

brand identity branding  Brand Design Advertising  visual identity Logo Design logo Logotype ride hailing ride

For more information make sure to check out Iliass Sabouny on Behance. 

BuhoCleaner for Mac Just Got Better (Review)

Original Source: https://www.hongkiat.com/blog/buhocleaner-for-mac/

Over time, your Mac gets filled with stuff you don’t need anymore: old files, duplicate photos, and apps you forgot you had. Just like a cluttered closet makes it hard to find what you want, a cluttered Mac will eventually slow down everything you do on your Mac. That’s where a Mac cleaner app, like BuhoCleaner, comes in handy.

Think of it as a personal helper to tidy up your Mac, getting rid of all the stuff you don’t need and making it run faster and smoother.

BuhoCleaner Interface on Mac

BuhoCleaner doesn’t just clean up; it also helps organize everything. It finds apps you don’t use and removes them safely, ensuring they don’t leave any mess behind. It also helps protect your privacy by clearing out your browsing history and cookies, keeping your online activities just for you.

BuhoCleaner Features:

With the latest update, BuhoCleaner is made to work perfectly with the latest macOS Sonoma and runs great whether you have a newer Mac or an older one. In this post, we’re going to explore the capabilities of this Mac cleaning app.

Cleaning Mac in one click

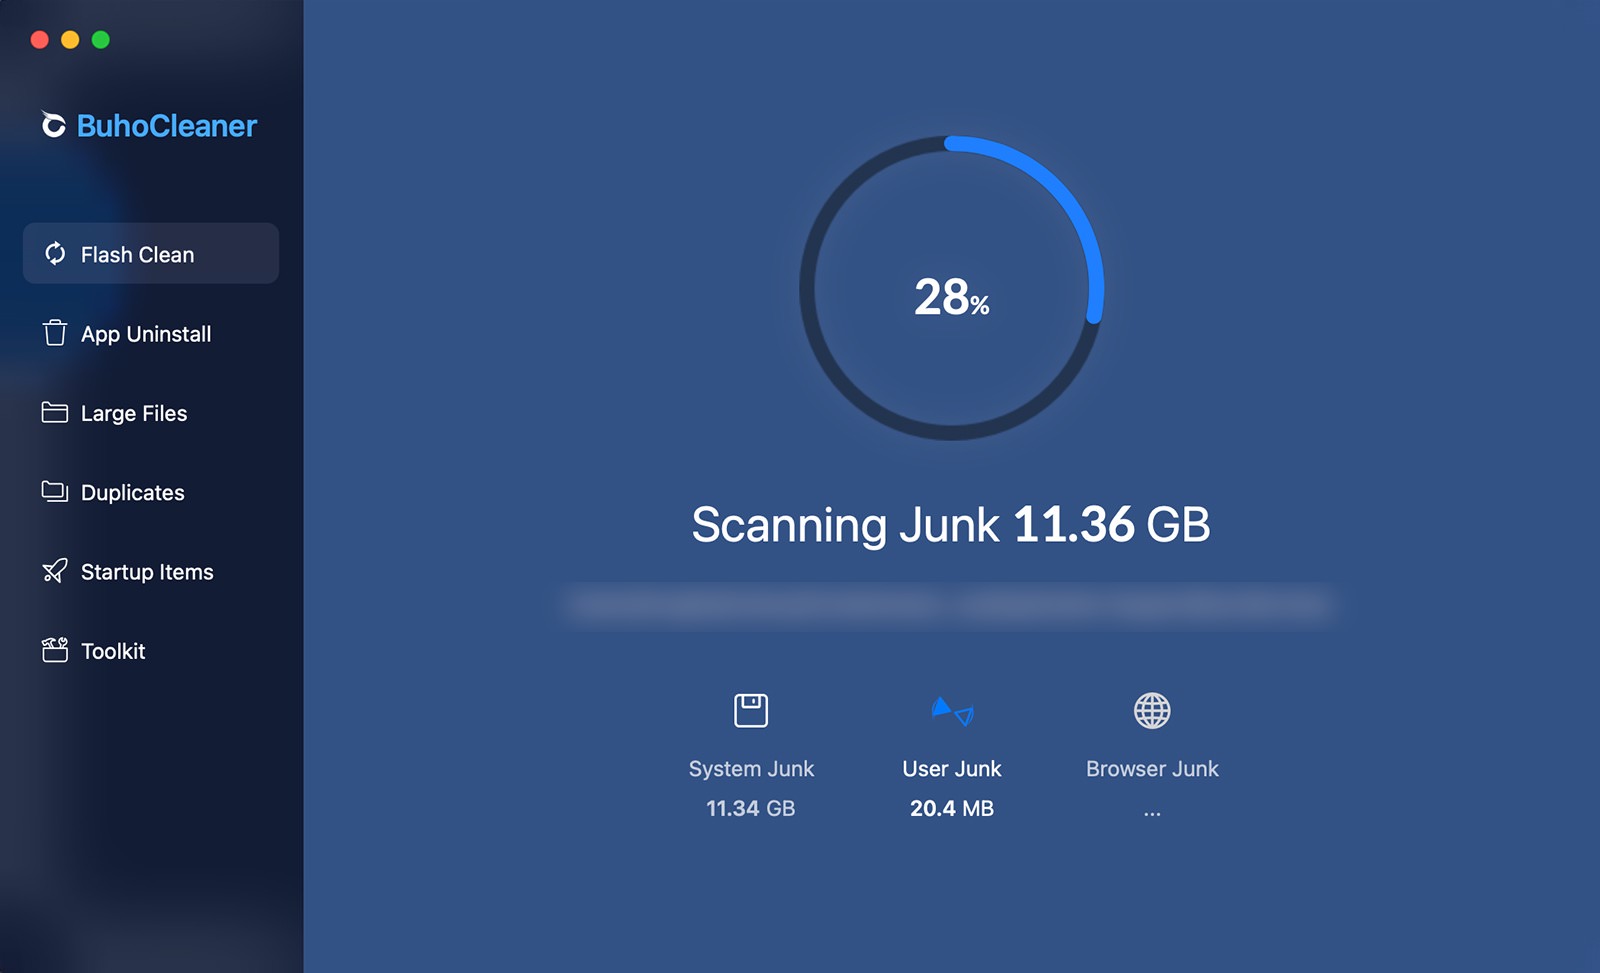
Flash Clean is a handy tool that helps you locate and remove unnecessary files from your Mac. Just hit the “Scan” button, and it will perform an in-depth search of your file system.

One-Click Clean Feature

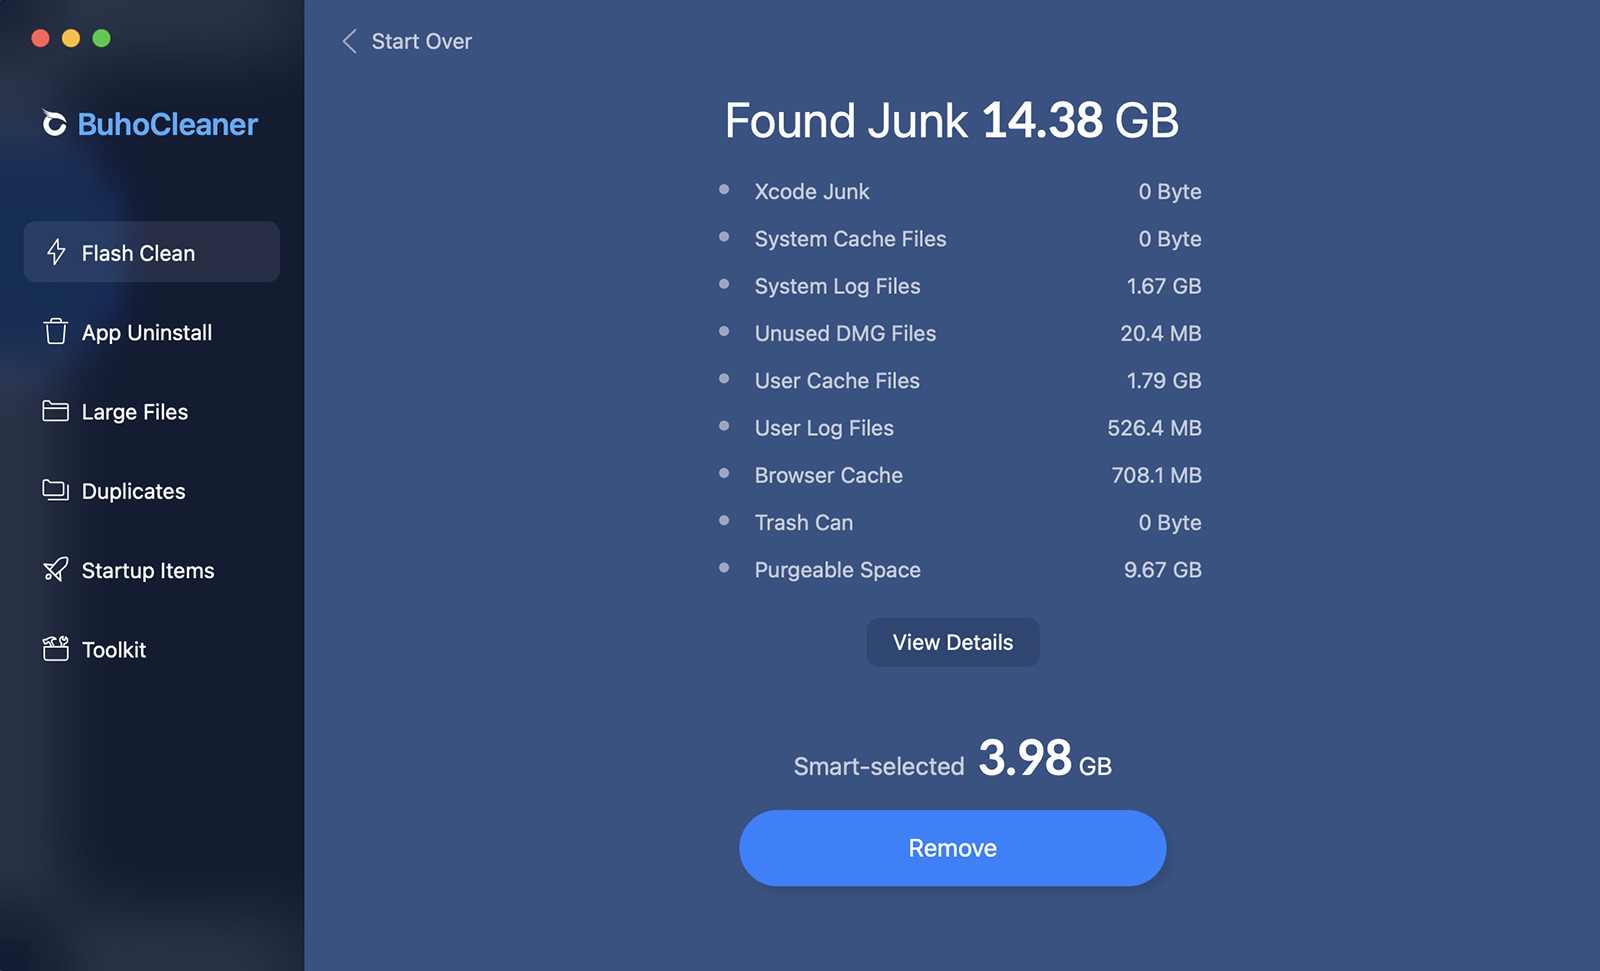
It carefully sifts through both user and system caches, along with user log files, to identify and get rid of all that unwanted clutter. By doing so, it helps free up valuable disk space.

Junk Files Detected Screenshot

However, it’s important to remember that you’ll need to grant the app full disk access so it can thoroughly explore your file system.

Finding and Deleting Duplicate Files

The “Duplicates” feature in BuhoCleaner assist Mac users in effectively finding and removing duplicate files and folders from their system. Its goal is to make the cleanup of unnecessary copies straightforward, thereby freeing up essential disk space and enhancing the performance of the computer. By focusing on duplicates, it enables users to keep their file system well-organized and efficient.

Duplicates feature
Uninstall Mac apps easily

Uninstalling apps on a Mac is as simple as dragging the app file to the trash. However, this method often leaves behind remnants—bits of the app stored in various places like your documents folder.

The “App Uninstall” feature takes the hassle out of cleaning up your Mac. It offers a straightforward and user-friendly interface that displays all the apps you’ve installed. With just a few clicks, you can identify and remove the ones you no longer use, including those pesky leftover files that hide in other folders or areas of your system.

App Uninstall Interface
Identify and delete large files

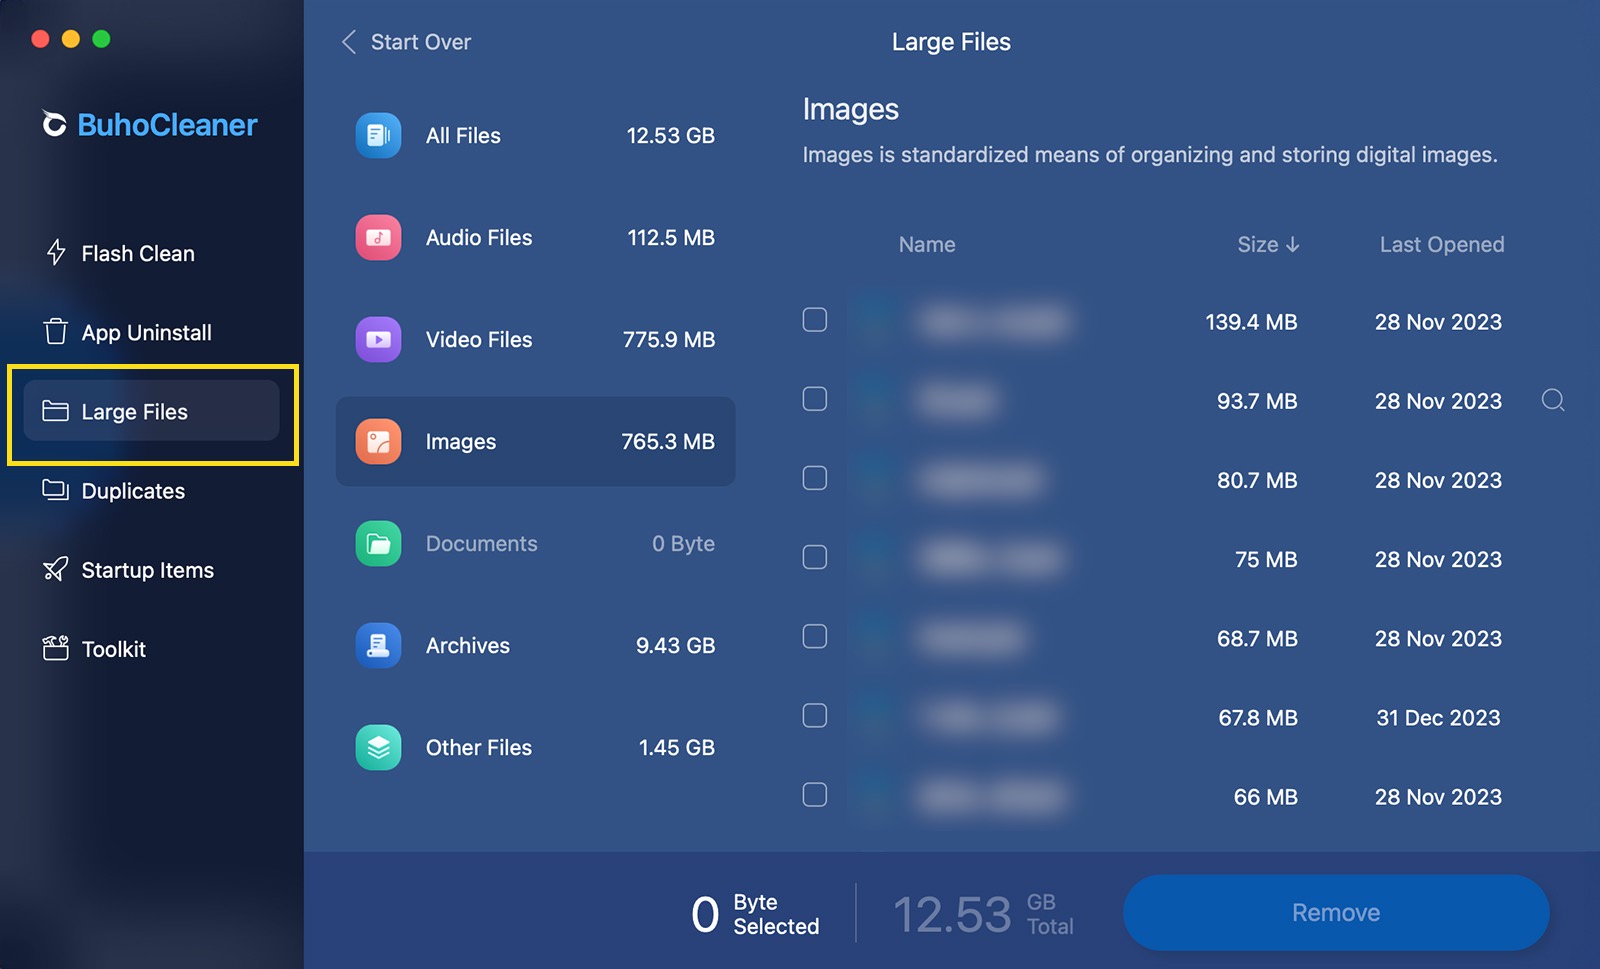
The “Large Files” feature is like a magnifying glass for your computer. It helps you spot the big, space-hogging files hidden in your file system. When you click “Scan,” BuhoCleaner brings these bulky files into view.

It organizes them by size and the last date you accessed them, allowing you to decide what to do next. You can bulk delete them or preview each one before deciding whether to delete it.

Large Files Finder
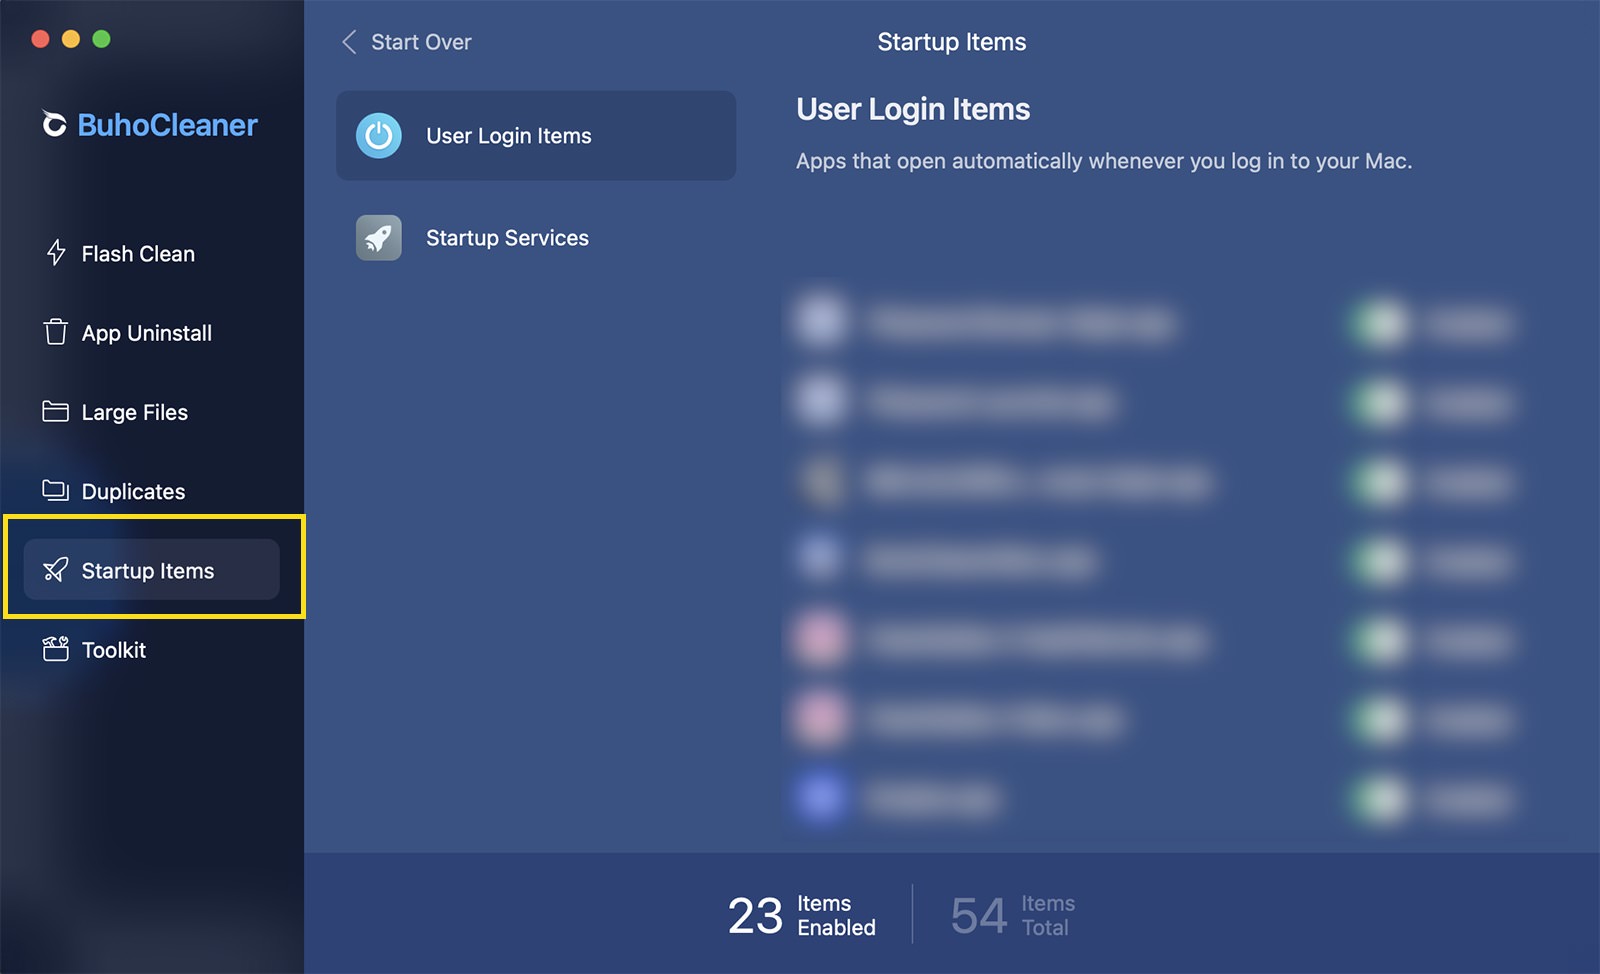
Inspect Mac’s startup items

Startup items are essentially apps or components that automatically launch every time you turn on your Mac or log into your account. They’re quite convenient, saving you the hassle of manually opening them each time. However, having too many can slow down your Mac.

BuhoCleaner’s Startup Item Management feature is designed to help you find and manage these items. It provides a list of all the apps that spring to life when your Mac starts. More importantly, it lets you to decide which ones to keep and which to remove, ensuring a smoother, faster startup.

Startup Items Management
Deep scan Mac’s file system

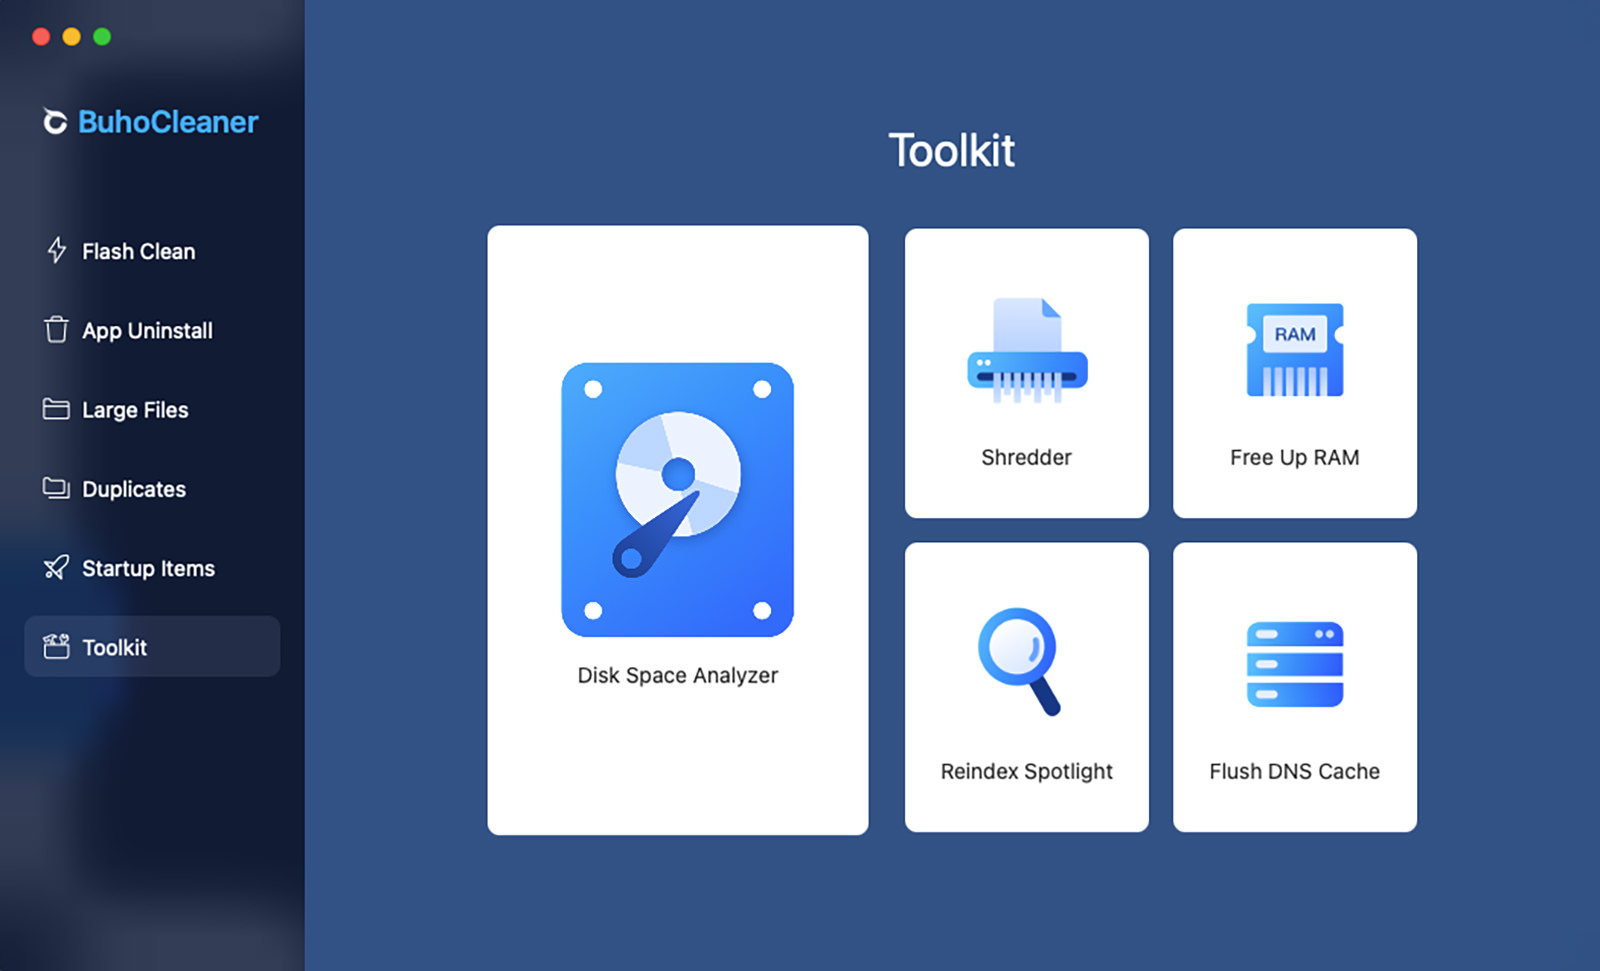
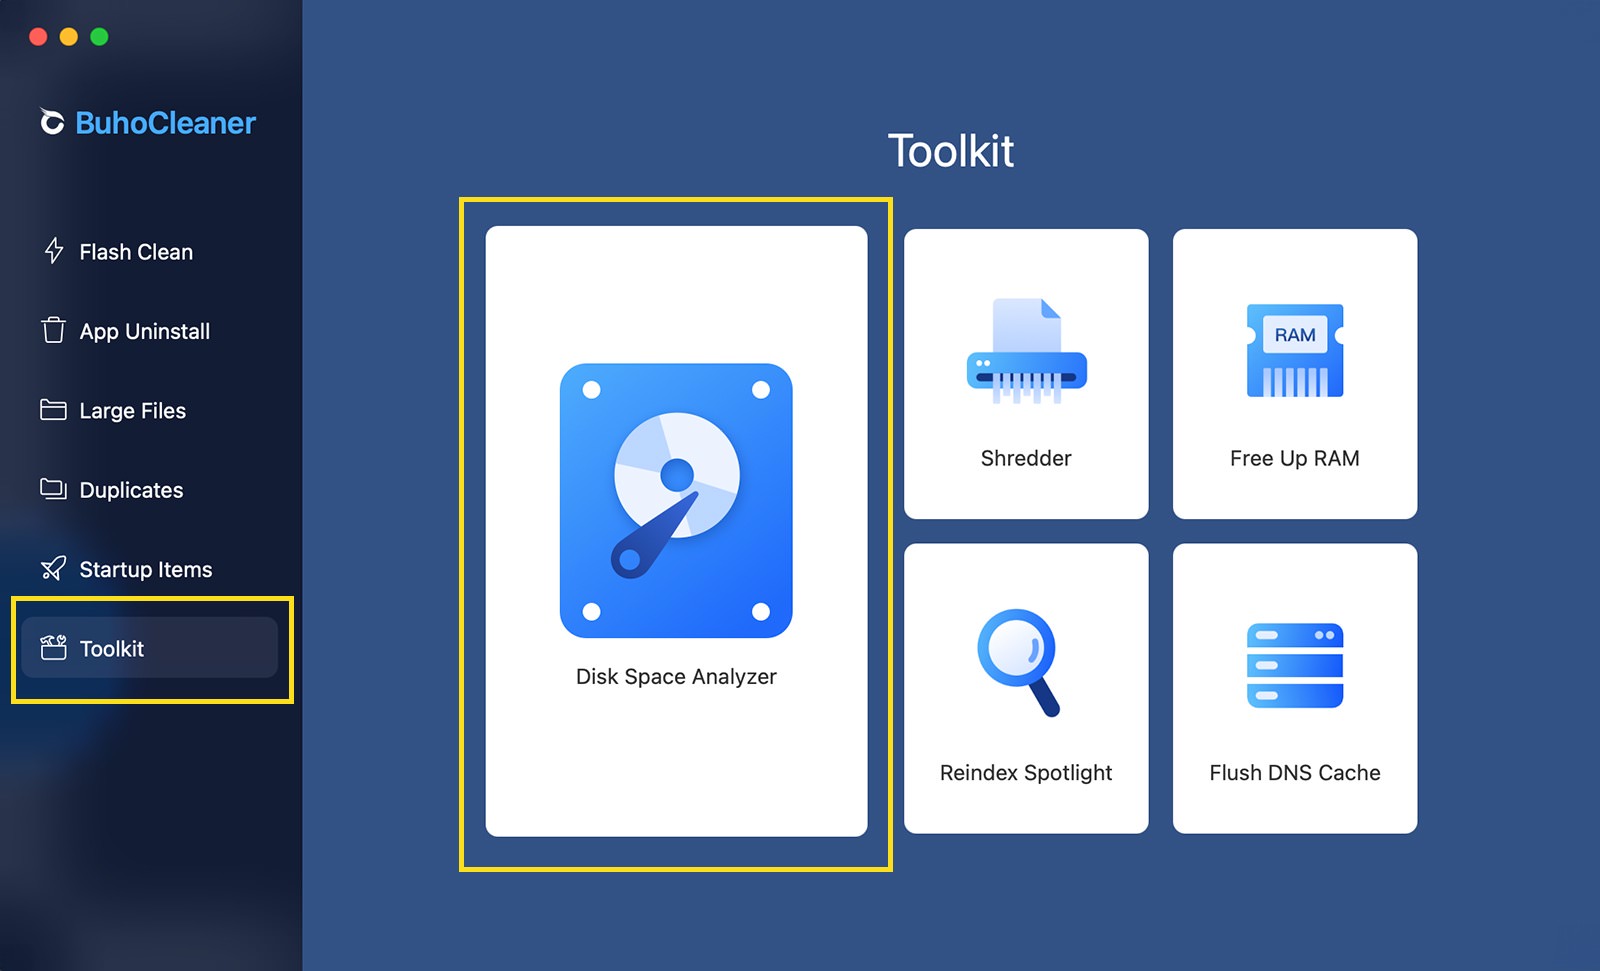
The “Disk Space Analyzer” feature, found within the Toolkit option, performs an in-depth scan of your entire system. It then presents a visual representation of how your disk space is being used, helping you decide which files and folders are taking up too much space and whether you should remove them.

Disk Space Analyzer Overview

This feature is similar to the previously mentioned “Flash Clean,” but it goes further, reaching into every nook and cranny of your Mac. To allow the app to create a complete map of your storage, you’ll need to grant it full access to your disk.

Shreddering sensitive files

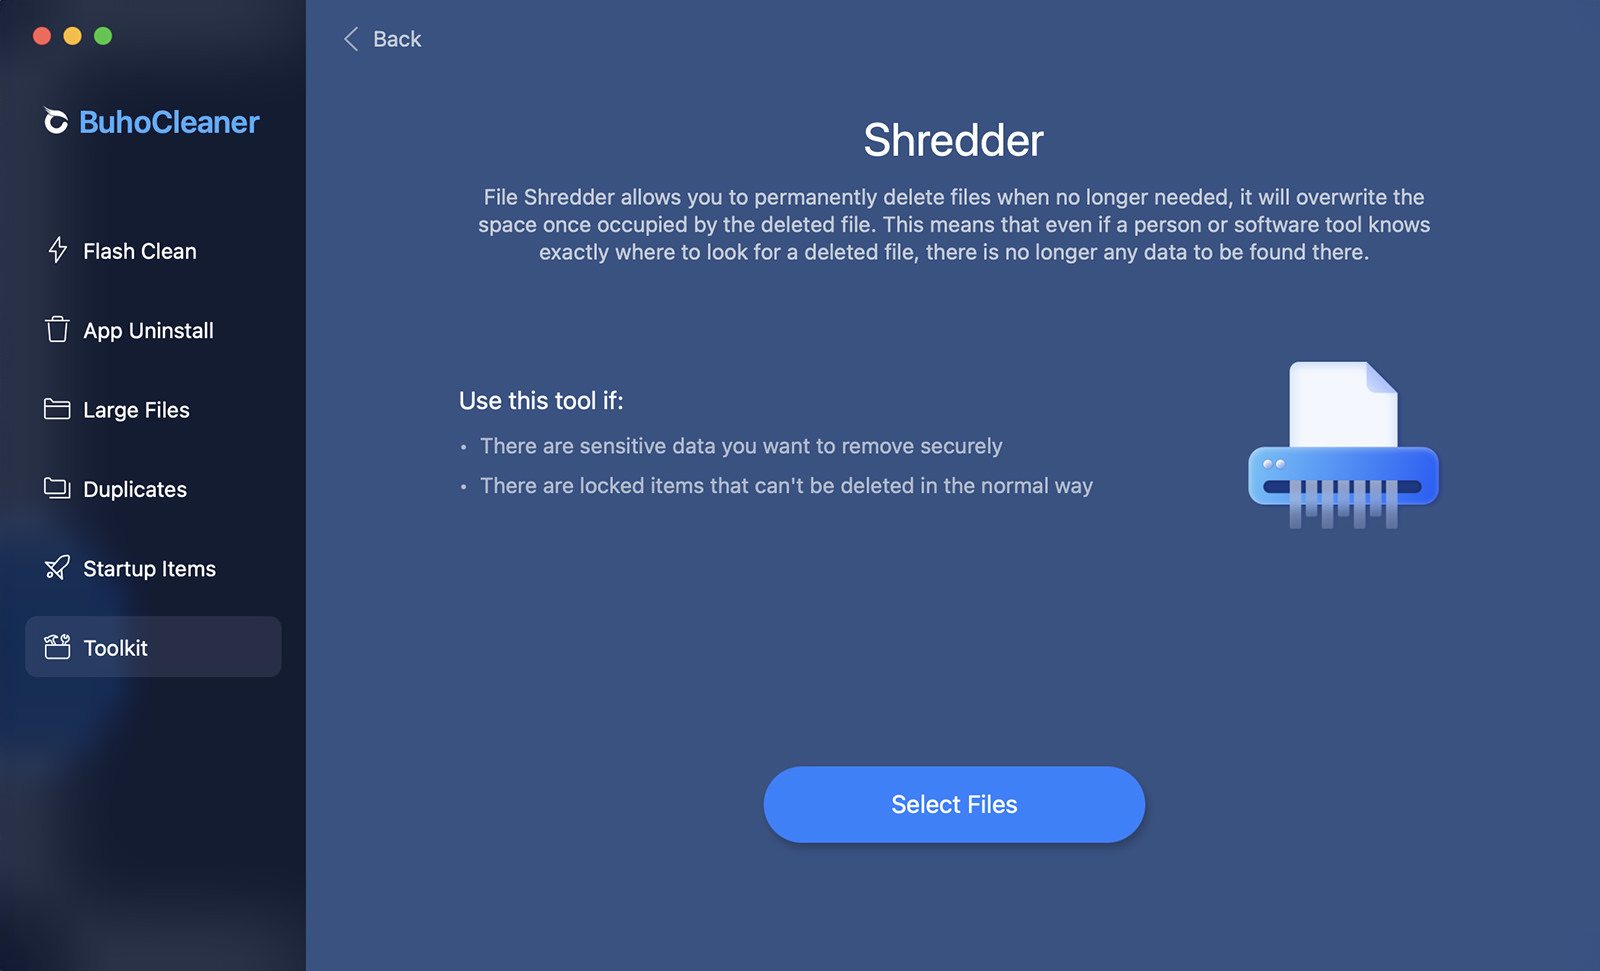
The “Shredder” feature, also found under the Toolkit option, allows users to permanently delete files or folders they no longer need while addressing security and privacy concerns. It securely overwrites the space previously occupied by the deleted file, making it nearly impossible for anyone or any software tool to retrieve or recover it, even if they know where to look.

File Shredder Feature

This feature is particularly useful when handling sensitive information such as personal details, confidential business documents, or anything you wouldn’t want to fall into the wrong hands.

BuhoCleaner’s Prices:

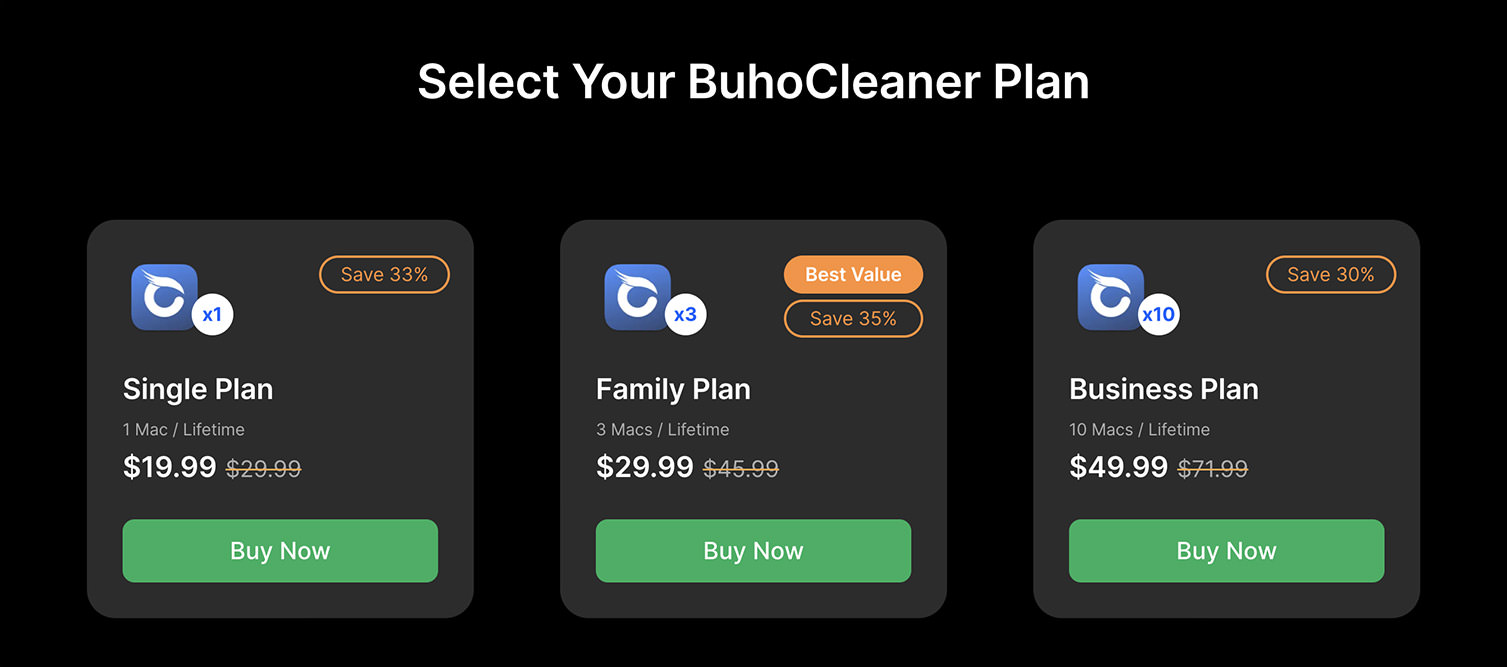
You can try the fully functional BuhoCleaner for FREE. The only limitation of the free version is how many files you can delete automatically. The trial version allows you to automatically delete the first 3GB of junk files for free. After reaching the 3GB limit, you can manually delete the remaining files.

BuhoCleaner Pricing Plans

They offer a couple of competitively priced plans that unlock this limitation, as follows:

Single Plan – (1 Mac/Lifetime) Regular Price $29.99 -> 2024 New Year Sale $19.99 -> Additional Discount $14.99 (Coupon Code: HONKIA23SG)
Family Plan – (3 Macs/Lifetime) Regular Price $45.99 – 2024 New Year Sale $29.99 -> Additional Discount $22.49 (Coupon Code: HONKIA23SG)
Business Plan – (10 Macs/Lifetime) Regular Price $71.99 -> 2024 New Year Sale $49.99 -> Additional Discount $37.49 (Coupon Code: HONKIA23SG)

All plans come with lifetime free upgrades!

Download BuhoCleaner

Final Thoughts

In this post, I’m sharing just a few features of the app that I particularly like, but keep in mind, these are merely a few of the features the app offers. The app has much more to offer than what’s mentioned here.

You can download Buhcleaner for free and give it a try, or you can unlock all its features with a one-time payment of $19.99. Plus, you can get an additional 20% off by using this promotional code: HONKIA23SG.

The post BuhoCleaner for Mac Just Got Better (Review) appeared first on Hongkiat.