18+ JavaScript Libraries for Creating Beautiful Charts
Original Source: https://www.sitepoint.com/best-javascript-charting-libraries/?utm_source=rss

It’s practically impossible to imagine any dashboard without graphs and charts. They present complex statistics quickly and effectively. Additionally, a good graph also enhances the overall design of your website.
In this article, I’ll show you some of the best JavaScript libraries for graphs / charts. These libraries will help you create beautiful and customisable charts for your future projects.
While most of the libraries are free and open source, some of them provide a paid version with additional features.
D3.js — Data-Driven Documents
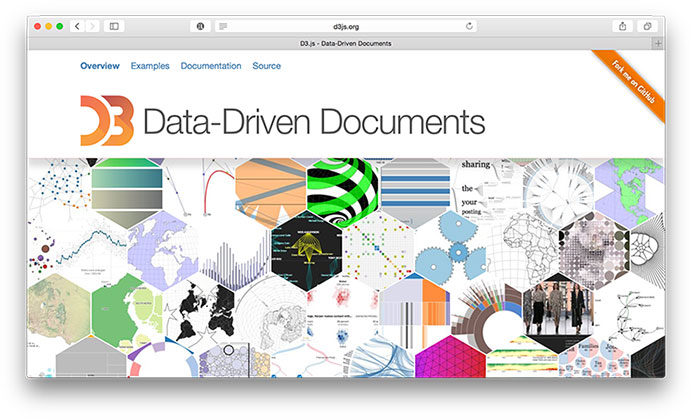
When we think of charting today, D3.js is the first name that comes up. Being an open source project, D3.js definitely brings many powerful features that were missing in most of the existing libraries. Features like “Enter and Exit”, powerful transitions and syntax familiarity with jQuery or Prototype make it one the best JavaScript libraries for charting. Charts in D3.js are rendered via HTML, SVG and CSS.
Unlike many other JavaScript libraries, D3.js doesn’t ship with any pre-built charts out of the box. However, you can look at the list of graphs built with D3.js to get an overview.
D3.js doesn’t work well with older browsers like IE8. You can always use plugins like aight plugin for cross browser compatibility.
Websites like NYTimes, Uber and Weather.com have used D3.js extensively in the past.
Google Charts
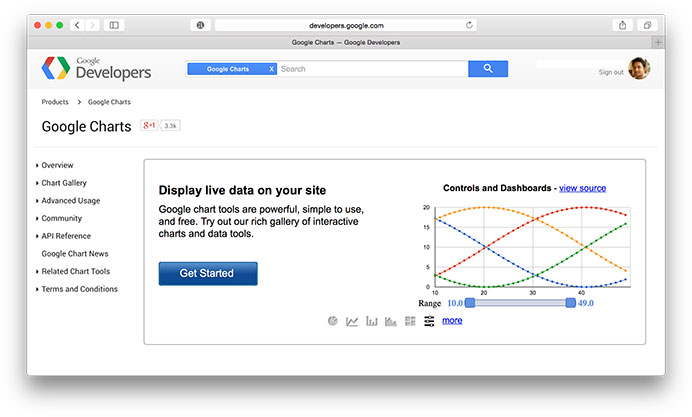
Google Charts is my go-to JavaScript library for creating charts easily. It provides many pre-built charts like area charts, bar charts, calendar charts, pie Charts, geo charts, and more.
Google charts also comes with various customization options that help in changing the look of the graph. Charts are rendered using HTML5/SVG to provide cross-browser compatibility and cross platform portability to iPhones, iPads, and Android. It also includes VML for supporting older IE versions.
Here’s a great list of examples built using Google charts.
ChartJS
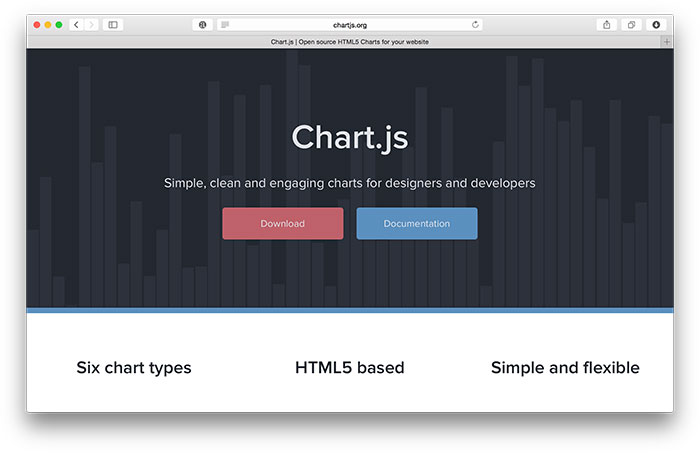
ChartJS provides beautiful flat designs for charts. It uses HTML5 canvas element for rendering. Support for older browsers like IE7/8 is added through polyfill.
ChartJS charts are responsive by default. They work well in mobiles and tablets. With 6 different types of core charts out of the box (core, bar, doughnut, radar, line, and polar area), ChartJS is definitely one of the most impressive open source charting libraries in recent times.
Chartist.js
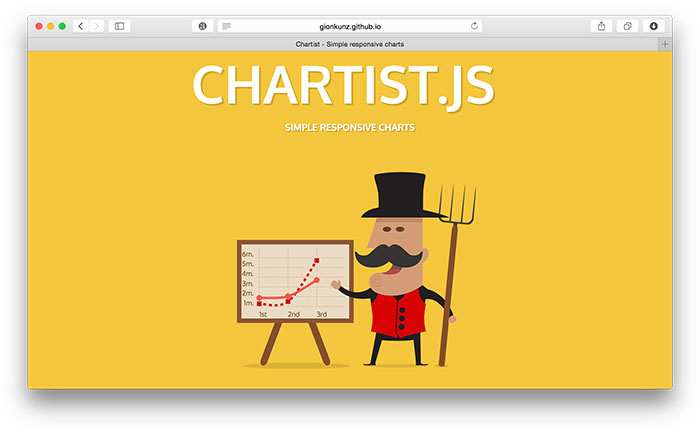
Chartist.js provides beautiful responsive charts. Just like ChartJS, Chartist.js is also the product of the community that was frustrated by using highly priced JavaScript charting libraries. It uses SVG to render the charts. It can be controlled and customised through CSS3 media queries and Sass. Also, note that Chartist.js provides cool animations that will work only in modern browsers.
n3-charts
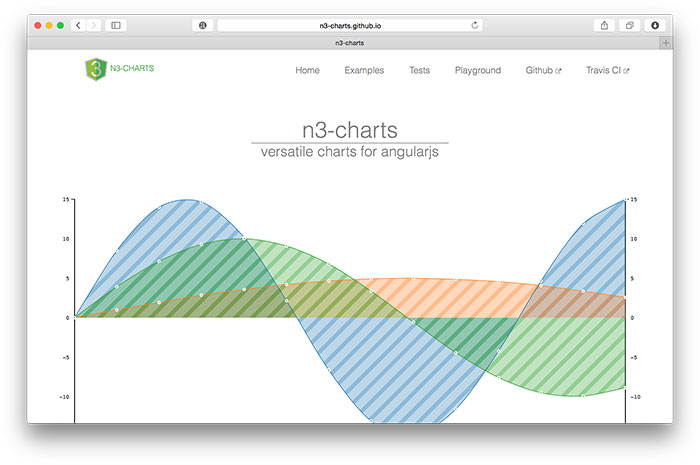
If you are an Angular developer, you will definitely find n3-charts extremely useful and interesting. n3-charts is built on top of D3.js and Angular. It provides various standard charts in the form of customisable Angular directives.
Checkout list of charts built using ns-charts.
Ember Charts
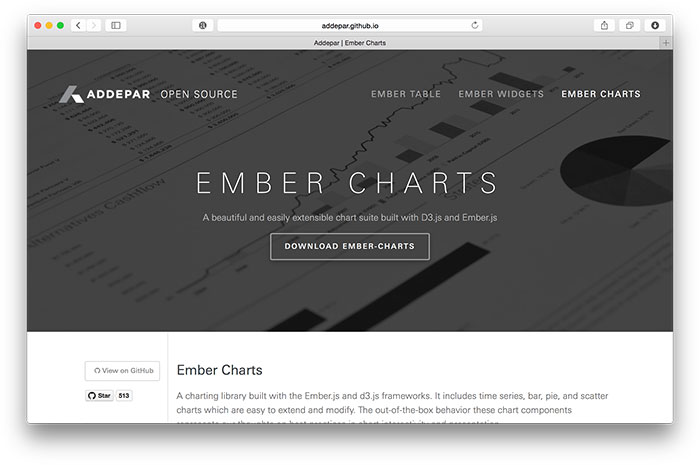
Ember Charts is another great open source repository built with D3.js and Ember.js. It provides time series, bar, pie, and scatter charts that are easily customisable. It uses SVG to render charts.
The post 18+ JavaScript Libraries for Creating Beautiful Charts appeared first on SitePoint.


Leave a Reply
Want to join the discussion?Feel free to contribute!