9 Free Data Visualization Tools
Original Source: http://feedproxy.google.com/~r/1stwebdesigner/~3/Vxx98XaxavI/
Data can be beautiful. And if you’ve ever had to work with graphs and statistics in your web design work before, you know that the extra visual reinforcement is much better than trying to figure out a bunch of numbers.
Writing a blog post, creating a chart for a client’s project, or just trying to get your own personal data sorted; these free tools are just what you need to make charts, graphs, and infographics that are both pretty and easy to understand.
Chartist
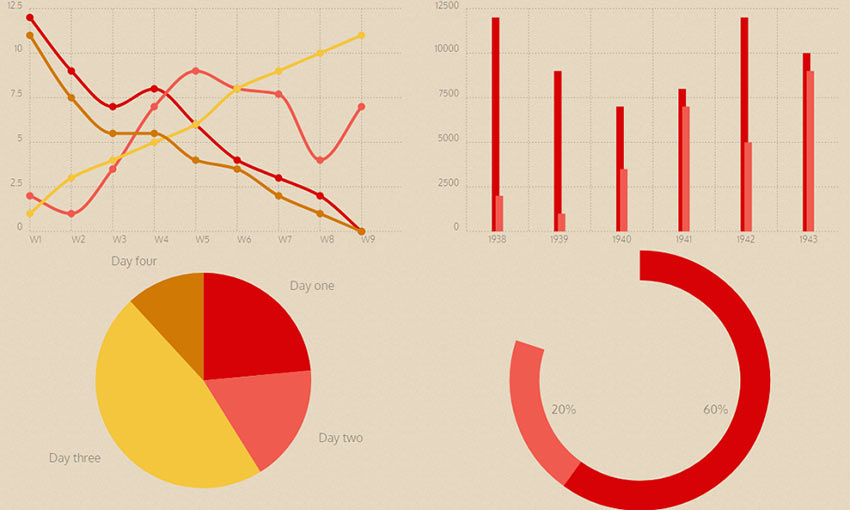
“Simple responsive charts” – no more, no less. Download this tiny program and create vector pie charts, line graphs and more that will scale to any screen size. You can even add animations! The graphs are highly compatible with a majority of web browsers, so there’s no reason not to use it. However, you will need to learn some JavaScript and CSS. The documentation should be a big help if you’re new to these languages.
RAWGraphs
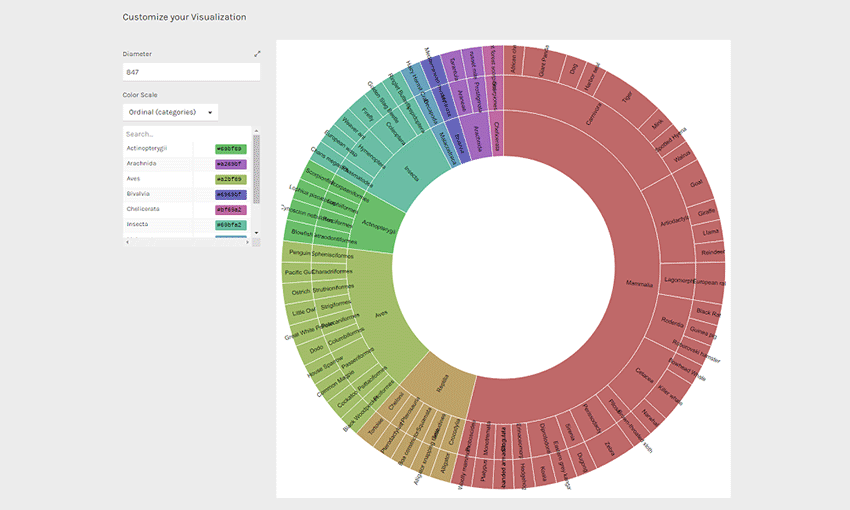
If you’re looking for variety, RAWGraphs has everything under the sun. Just paste in your spreadsheet data or upload a file, and you’ll be able to convert the numbers to anything from a bar graph to a bump chart! You can even add your own chart type if you’re familiar with JavaScript. When done customizing, you can download as a SVG, PNG or JSON file. Or just embed the vector into your site. This advanced program isn’t the easiest to use, but it has a lot of potential.
Datawrapper
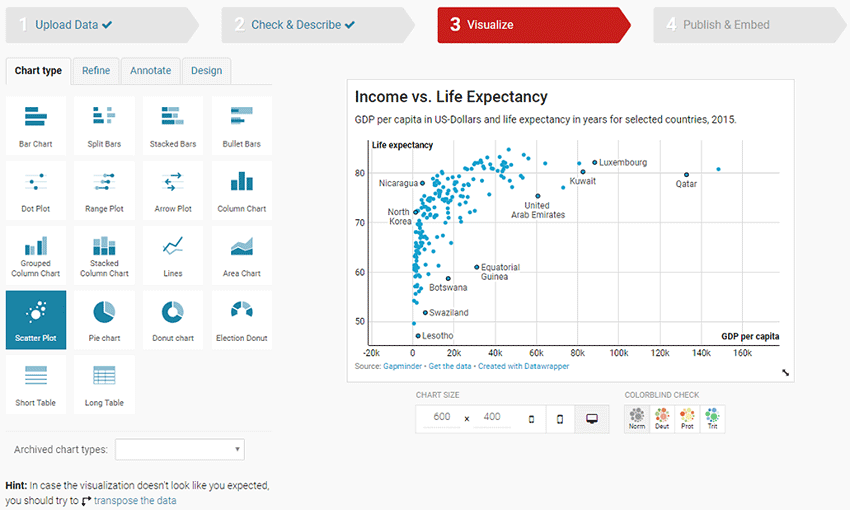
If you have spreadsheet data you want to include in an article, Datawrapper makes it easy to turn it into a beautiful graph. It’s not hard at all, and the graphs are fully customizable down to text alignment and color customization (there are even color-blind filters!) When you’re finished, you just need to sign up and you’ll get the embed code for the chart.
Tableau
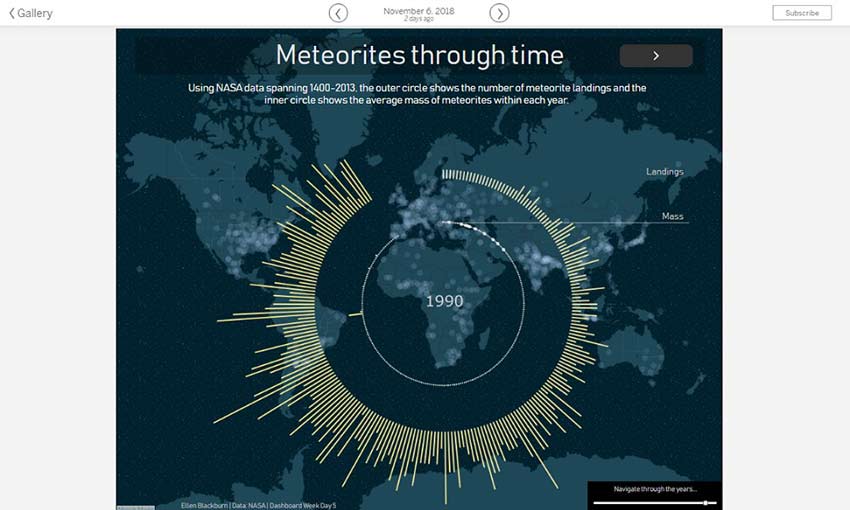
Need something professional? Tableau Public is a downloadable tool that allows you to visualize data in a variety of ways. Suitable for anything from small charts to dedicated infographics, the app is a great choice for web designers.
ChartBlocks
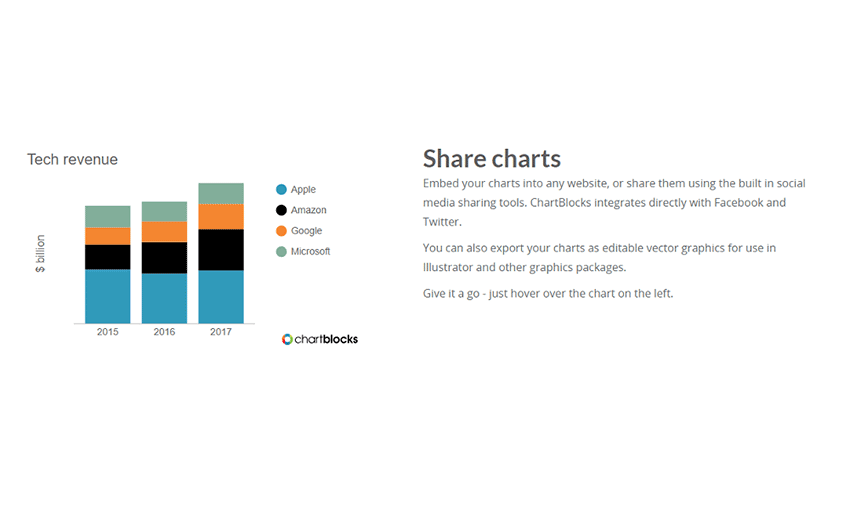
“The world’s easiest chart builder” is exactly what it says. Insert some spreadsheet data, do a little tweaking, pick a theme and you’ve got yourself a chart in less than a minute. If you want to, you can tweak the appearance further. Or you can just download it, embed it or share it on social media!
Beam
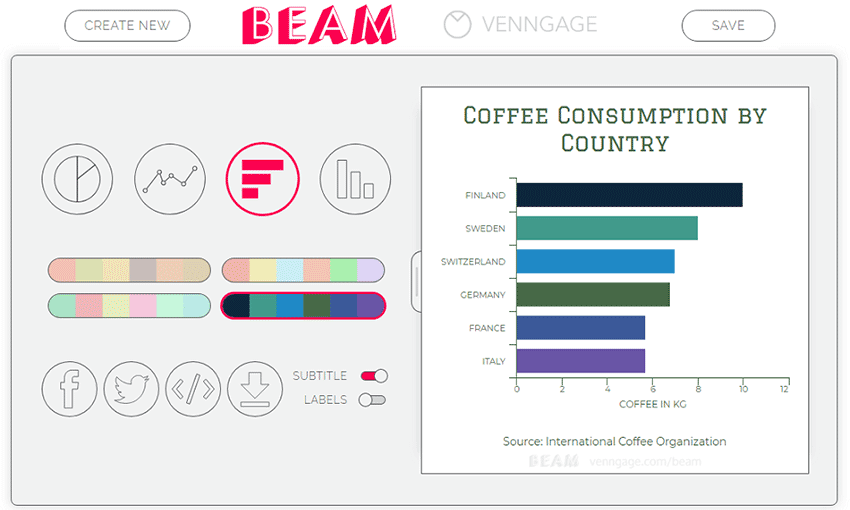
Are all these programs too complicated? Just need to make a simple graph from a handful of data without importing a bunch of files? Just tweak a few names and data points, pick from four types of simple charts, and choose a color profile. Easy as that!
Visualize Free
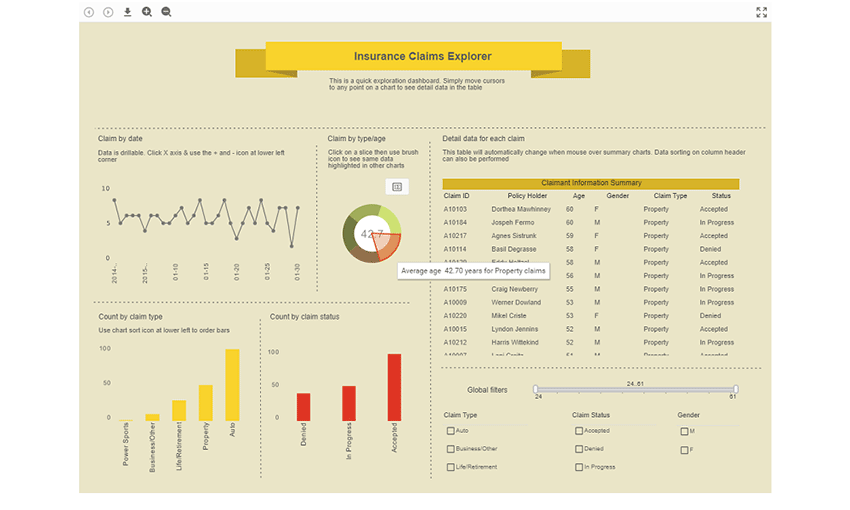
This drag-and-drop program is a fantastic way to create beautiful infographics that involve a lot of data. You’ll need to sign up to use the app, but there are a bunch of examples on the homepage that you’re free to customize while getting a feel for the dashboard.
OpenHeatMap
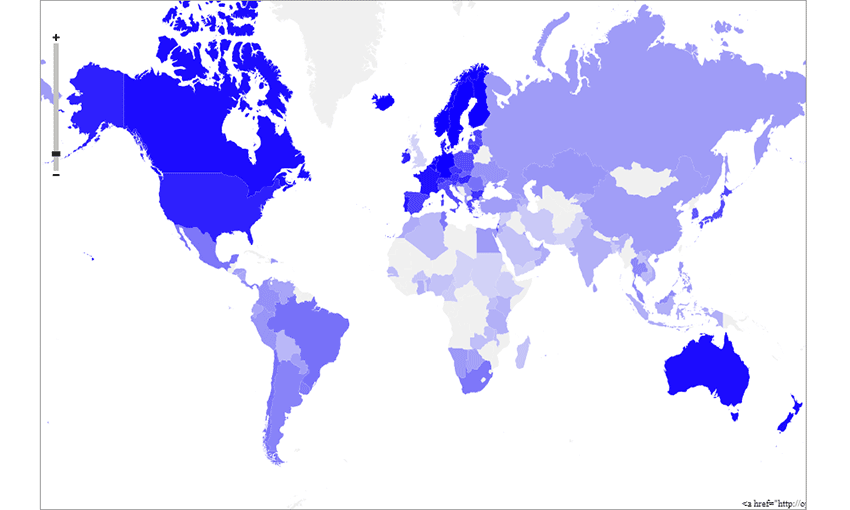
This app is amazing simply because it’s so easy to use! Upload a spreadsheet or Excel file – get a beautiful heatmap with an embed code. The process is clean and perfectly streamlined.
Timeline
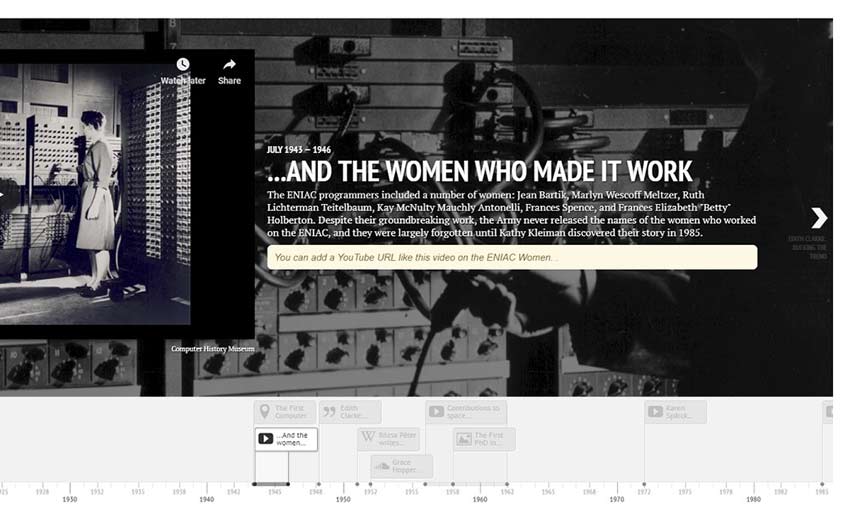
This one is a bit more difficult to set up, since you’ll need to follow the steps exactly and create a new spreadsheet. But if you need an embeddable interactive timeline for your project, this is the app you’re looking for.
Beautiful Data
Breaking up text with visually stimulating images is a great way to prevent a webpage from looking bland. With these free tools, you’ll be able to create interesting graphs and charts that will draw in anyone who sees them, and in minutes. No more spending hours trying to make your own infographics!

Leave a Reply
Want to join the discussion?Feel free to contribute!