Exclusive Freebie: Start Up Icons

Original Source: https://inspiredm.com/exclusive-freebie-start-up-icons/

Every day there’s a new opportunity, a new venue & new horizons for the entrepreneurs with the aim to make it happen, that’s why we’re looking to help: check out the latest free icons pack from Iconshock.com & bypeople.com: 30 unique items, including vector Adobe Illustrator & SVG Files, also adding PNG’s in three different sizes.

All the icons in this pack are free for both personal and commercial projects, so you won’t find any limits to focus on the important: make your business profitable and sustainable!

Get these amazing icons from here

The post Exclusive Freebie: Start Up Icons appeared first on Inspired Magazine.

ES6 (ES2015) and Beyond: Understanding JavaScript Versioning

Original Source: https://www.sitepoint.com/javascript-versioning-es6-es2015/

As programming languages go, JavaScript’s development has been positively frantic in the last few years. With each year now seeing a new release of the ECMAScript specification, it’s easy to get confused about JavaScript versioning, which version supports what, and how you can future-proof your code.

To better understand the how and why behind this seemingly constant stream of new features, let’s take a brief look at the history of the JavaScript and JavaScript versioning, and find out why the standardization process is so important.

The Early History of JavaScript Versioning

The prototype of JavaScript was written in just ten days in May 1995 by Brendan Eich. He was initially recruited to implement a Scheme runtime for Netscape Navigator, but the management team pushed for a C-style language that would complement the then recently released Java.

JavaScript made its debut in version 2 of Netscape Navigator in December 1995. The following year, Microsoft reverse-engineered JavaScript to create their own version, calling it JScript. JScript shipped with version 3 of the Internet Explorer browser, and was almost identical to JavaScript — even including all the same bugs and quirks — but it did have some extra Internet Explorer-only features.

The Birth of ECMAScript

The necessity of ensuring that JScript (and any other variants) remained compatible with JavaScript motivated Netscape and Sun Microsystems to standardize the language. They did this with the help of the European Computer Manufacturers Association, who would host the standard. The standardized language was called ECMAScript to avoid infringing on Sun’s Java trademark — a move that caused a fair deal of confusion. Eventually ECMAScript was used to refer to the specification, and JavaScript was (and still is) used to refer to the language itself.

The working group in charge of JavaScript versioning and maintaining ECMAScript is known as Technical Committee 39, or TC39. It’s made up of representatives from all the major browser vendors such as Apple, Google, Microsoft and Mozilla, as well as invited experts and delegates from other companies with an interest in the development of the Web. They have regular meetings to decide on how the language will develop.

When JavaScript was standardized by TC39 in 1997, the specification was known as ECMAScript version 1. Subsequent versions of ECMAScript were initially released on an annual basis, but ultimately became sporadic due to the lack of consensus and the unmanageably large feature set surrounding ECMAScript 4. This version was thus terminated and downsized into 3.1, but wasn’t finalized under that moniker, instead eventually evolving into ECMAScript 5. This was released in December 2009, 10 years after ECMAScript 3, and introduced a JSON serialization API, Function.prototype.bind, and strict mode, amongst other capabilities. A maintenance release to clarify some of the ambiguity of the latest iteration, 5.1, was released two years later.

Do you want to dive deeper into the history of JavaScript? Then check out chapter one of JavaScript: Novice to Ninja, 2nd Edition.

ECMAScript 2015 and the Resurgence of Yearly Releases

With the resolution of TC39’s disagreement resulting from ECMAScript 4, Brendan Eich stressed the need for nearer-term, smaller releases. The first of these new specifications was ES2015 (originally named ECMAScript 6, or ES6). This edition was a large but necessary foundation to support the future, annual JavaScript versioning. It includes many features that are well-loved by many developers today, such as:

Classes
Promises
Arrow functions
ES Modules
Generators and Iterators

ES2015 was the first offering to follow the TC39 process, a proposal-based model for discussing and adopting elements.

Continue reading %ES6 (ES2015) and Beyond: Understanding JavaScript Versioning%

Cheerful Desktop Wallpapers To Kick Off June (2018 Edition)

Original Source: https://www.smashingmagazine.com/2018/05/desktop-wallpaper-calendars-june-2018/

Cheerful Desktop Wallpapers To Kick Off June (2018 Edition)

Cheerful Desktop Wallpapers To Kick Off June (2018 Edition)

Cosima Mielke

2018-05-31T08:43:08+02:00
2018-05-31T11:49:45+00:00

We all need a little inspiration boost every once in a while. And, well, whatever your strategy to get your creative juices flowing might be, sometimes inspiration lies closer than you think. As close as your desktop even.

Since more than nine years, we’ve been asking the design community to create monthly desktop wallpaper calendars. Wallpapers that are a bit more distinctive as what you’ll usually find out there, bound to cater for a little in-between inspiration spark. Of course, it wasn’t any different this time around.

This post features wallpapers for June 2018. All of them come in versions with and without a calendar, so it’s up to you to decide if you want to have the month at a glance or keep things simple. As a bonus goodie, we also collected some timeless June favorites from past years for this edition (please note that they thus don’t come with a calendar). A big thank-you to all the artists who have submitted their wallpapers and are still diligently continuing to do so. It’s time to freshen up your desktop!

Please note that:

All images can be clicked on and lead to the preview of the wallpaper,
You can feature your work in our magazine by taking part in our Desktop Wallpaper Calendar series. We are regularly looking for creative designers and artists to be featured on Smashing Magazine. Are you one of them?

What if there was a web conference without… slides? Meet SmashingConf Toronto 2018 ?? with live sessions exploring how experts work behind the scenes. Dan Mall, Lea Verou, Sara Soueidan, Seb Lee-Delisle and many others. June 26–27. With everything from live designing to live performance audits.

Check the speakers →

SmashingConf Toronto 2018, with Dan Mall, Sara Soueidan, Lea Verou and many others.

Travel Time

“June is our favorite time of the year because the keenly anticipated sunny weather inspires us to travel. Stuck at the airport, waiting for our flight but still excited about wayfaring, we often start dreaming about the new places we are going to visit. Where will you travel to this summer? Wherever you go, we wish you a pleasant journey!” — Designed by PopArt Studio from Serbia.

Travel Time

preview
with calendar: 320×480, 640×480, 800×480, 800×600, 1024×768, 1024×1024, 1152×864, 1280×720, 1280×800, 1280×960, 1280×1024, 1400×1050, 1440×900, 1600×1200, 1680×1050, 1680×1200, 1920×1080, 1920×1200, 1920×1440, 2560×1440
without calendar: 320×480, 640×480, 800×480, 800×600, 1024×768, 1024×1024, 1152×864, 1280×720, 1280×800, 1280×960, 1280×1024, 1400×1050, 1440×900, 1600×1200, 1680×1050, 1680×1200, 1920×1080, 1920×1200, 1920×1440, 2560×1440

Tropical Vibes

“With summer just around the corner, I’m already feeling the tropical vibes.” — Designed by Melissa Bogemans from Belgium.

Tropical Vibes

preview
with calendar: 320×480, 640×480, 800×480, 800×600, 1024×768, 1024×1024, 1152×864, 1280×720, 1280×800, 1280×960, 1280×1024, 1400×1050, 1440×900, 1600×1200, 1680×1050, 1680×1200, 1920×1080, 1920×1200, 1920×1440, 2560×1440
without calendar: 320×480, 640×480, 800×480, 800×600, 1024×768, 1024×1024, 1152×864, 1280×720, 1280×800, 1280×960, 1280×1024, 1400×1050, 1440×900, 1600×1200, 1680×1050, 1680×1200, 1920×1080, 1920×1200, 1920×1440, 2560×1440

No Matter What, I’ll Be There

“June is the month when we celebrate our dads and to me the best ones are the ones that even if they don’t like what you are doing they’ll be by your side.” — Designed by Maria Keller from Mexico.

No Matter What, I’ll Be There

preview
with calendar: 320×480, 640×480, 640×1136, 750×1334, 800×480, 800×600, 1024×768, 1024×1024, 1125×2436, 1152×864, 1242×2208, 1280×720, 1280×800, 1280×960, 1280×1024, 1366×768, 1400×1050, 1440×900, 1600×1200, 1680×1050, 1680×1200, 1920×1080, 1920×1200, 1920×1440, 2560×1440, 2880×1800
without calendar: 320×480, 640×480, 640×1136, 750×1334, 800×480, 800×600, 1024×768, 1024×1024, 1125×2436, 1152×864, 1242×2208, 1280×720, 1280×800, 1280×960, 1280×1024, 1366×768, 1400×1050, 1440×900, 1600×1200, 1680×1050, 1680×1200, 1920×1080, 1920×1200, 1920×1440, 2560×1440, 2880×1800

We Sailed Across The Summer Sea

“Summer is the season of family trips, outings and holidays. What better way is there to celeberate Father’s Day, than to enjoy the summer sailing across with father beloved.” — Designed by The Whisky Corporation from Singapore.

We Sailed Across The Summer Sea

preview
with calendar: 320×480, 640×480, 800×480, 800×600, 1024×768, 1024×1024, 1152×864, 1280×720, 1280×800, 1280×960, 1280×1024, 1366×768, 1400×1050, 1440×900, 1600×1200, 1680×1050, 1680×1200, 1920×1080, 1920×1200, 1920×1440, 2560×1440
without calendar: 320×480, 640×480, 800×480, 800×600, 1024×768, 1024×1024, 1152×864, 1280×720, 1280×800, 1280×960, 1280×1024, 1366×768, 1400×1050, 1440×900, 1600×1200, 1680×1050, 1680×1200, 1920×1080, 1920×1200, 1920×1440, 2560×1440

Sounds Of Rain

“When it rains the world softens and listens to the gentle pattering of the rain. It gets covered in a green vegetation and puddles reflect the colors of nature now looking fresh and cleansed. The lullaby of the rain is accustomed to creaky frogs and soft chirping birds taking you to ecstasy.” — Designed by Aviv Digital from India.

Sounds Of Rain

preview
with calendar: 320×480, 640×480, 800×480, 800×600, 1024×768, 1024×1024, 1152×864, 1280×720, 1280×800, 1280×960, 1280×1024, 1366×768, 1400×1050, 1440×900, 1600×1200, 1680×1050, 1680×1200, 1920×1080, 1920×1200, 1920×1440, 2560×1440
without calendar: 320×480, 640×480, 800×480, 800×600, 1024×768, 1024×1024, 1152×864, 1280×720, 1280×800, 1280×960, 1280×1024, 1366×768, 1400×1050, 1440×900, 1600×1200, 1680×1050, 1680×1200, 1920×1080, 1920×1200, 1920×1440, 2560×1440

-SmashingConf Toronto

“What’s the best way to learn? By observing designers and developers working live. For our new conference in Toronto, all speakers aren’t allowed to use any slides at all. Welcome SmashingConf #noslides, a brand new conference in Toronto, full of interactive live sessions, showing how web designers design and how web developers build — including setup, workflow, design thinking, naming conventions and everything in-between.” — Designed by Ricardo Gimenes from Brazil.

Smashing Conference Toronto 2018

preview
with calendar: 320×480, 640×480, 800×480, 800×600, 1024×768, 1024×1024, 1152×864, 1280×720, 1280×800, 1280×960, 1280×1024, 1366×768, 1400×1050, 1440×900, 1600×1200, 1680×1050, 1680×1200, 1920×1080, 1920×1200, 1920×1440, 2560×1440
without calendar: 320×480, 640×480, 800×480, 800×600, 1024×768, 1024×1024, 1152×864, 1280×720, 1280×800, 1280×960, 1280×1024, 1366×768, 1400×1050, 1440×900, 1600×1200, 1680×1050, 1680×1200, 1920×1080, 1920×1200, 1920×1440, 2560×1440

Are You Ready?

“The excitement is building, the slogans are ready, the roaring and the cheering make their way… Russia is all set for the football showdown. Are you ready?” — Designed by Sweans from London.

Are You Ready?

preview
with calendar: 320×480, 640×480, 800×480, 800×600, 1024×768, 1152×864, 1280×720, 1280×800, 1280×960, 1280×1024, 1366×768, 1400×1050, 1440×900, 1600×1200, 1680×1050, 1680×1200, 1920×1080, 1920×1200, 1920×1440, 2560×1440
without calendar: 320×480, 640×480, 800×480, 800×600, 1024×768, 1152×864, 1280×720, 1280×800, 1280×960, 1280×1024, 1366×768, 1400×1050, 1440×900, 1600×1200, 1680×1050, 1680×1200, 1920×1080, 1920×1200, 1920×1440, 2560×1440

Summer Surf

“Summer vibes…” — Designed by Antun Hirsman from Croatia.

Summer Surf

preview
with calendar: 640×480, 1152×864, 1280×1024, 1440×900, 1680×1050, 1920×1080, 1920×1440, 2650×1440
without calendar: 640×480, 1152×864, 1280×1024, 1440×900, 1680×1050, 1920×1080, 1920×1440, 2650×1440

Stop Child Labor

“‘Child labor and poverty are inevitably bound together, and if you continue to use the labor of children as the treatment for the social disease of poverty, you will have both poverty and child labor to the end of time.’ (Grace Abbott)” — Designed by Dipanjan Karmakar from India.

Stop Child Labor

preview
with calendar: 1280×800, 1280×960, 1280×1024, 1400×1050, 1440×900, 1680×1050, 1920×1080
without calendar: 1280×800, 1280×960, 1280×1024, 1400×1050, 1440×900, 1680×1050, 1920×1080

Is your pattern library up to date today? Alla Kholmatova has just finished a fully fledged book on Design Systems and how to get them right. With common traps, gotchas and the lessons she learned. Hardcover, eBook. Just sayin’.

Table of Contents →

June Best-Of

Some things are too good to be forgotten. That’s why we dug out some June favorites from our archives. Please note that these don’t come with a calendar because of this. Enjoy!

Oh, The Places You Will Go!

“In celebration of high school and college graduates ready to make their way in the world!” — Designed by Bri Loesch from the United States.

Oh the places you will go

preview
without calendar: 320×480, 1024×768, 1280×1024, 1440×900, 1680×1050, 1680×1200, 1920×1440, 2560×1440

Join The Wave

“The month of warmth and nice weather is finally here. We found inspiration in the World Oceans Day which occurs on June 8th and celebrates the wave of change worldwide. Join the wave and dive in!” — Designed by PopArt Studio from Serbia.

Join The Wave

preview
without calendar: 320×480, 640×480, 800×480, 800×600, 1024×768, 1024×1024, 1152×864, 1280×720, 1280×800, 1280×960, 1280×1024, 1366×768, 1400×1050, 1440×900, 1600×1200, 1680×1050, 1680×1200, 1920×1080, 1920×1200, 1920×1440, 2560×1440

Solstice Sunset

“June 21 marks the longest day of the year for the Northern Hemisphere – and sunsets like these will be getting earlier and earlier after that!” — Designed by James Mitchell from the United Kingdom.

Solstice Sunset

preview
without calendar: 1280×720, 1280×800, 1366×768, 1440×900, 1680×1050, 1920×1080, 1920×1200, 2560×1440, 2880×1800

Midsummer Night’s Dream

“The summer solstice in the northern hemisphere is nigh. Every June 21 we celebrate the longest day of the year and, very often, end up dancing like pagans. Being landlocked, we here in Serbia can only dream about tidal waves and having fun at the beach. What will your Midsummer Night’s Dream be?” — Designed by PopArt Studio from Serbia.

Midsummer Night’s Dream

preview
without calendar: 320×480, 640×480, 800×480, 800×600, 1024×768, 1024×1024, 1152×864, 1280×720, 1280×800, 1280×960, 1280×1024, 1366×768, 1440×900, 1440×1050, 1600×1200, 1680×1050, 1680×1200, 1920×1080, 1920×1200, 1920×1440, 2560×1440

Flamingood Vibes Only

“I love flamingos! They give me a happy feeling that I want to share with the world.” — Designed by Melissa Bogemans from Belgium.

Flamingood Vibes Only

preview
without calendar: 320×480, 640×480, 800×480, 800×600, 1024×768, 1024×1024, 1152×864, 1280×720, 1280×800, 1280×960, 1280×1024, 1400×1050, 1440×900, 1600×1200, 1680×1050, 1680×1200, 1920×1200, 1920×1440, 2560×1440

Papa Merman

“Dream away for a little while to a land where June never ends. Imagine the ocean, feel the joy of a happy and carefree life with a scent of shrimps and a sound of waves all year round. Welcome to the world of Papa Merman!” — Designed by GraphicMama from Bulgaria.

Papa Merman

preview
without calendar: 320×480, 640×480, 800×480, 800×600, 1024×768, 1024×1024, 1152×864, 1280×720, 1280×800, 1280×960, 1280×1024, 1366×768, 1400×1050, 1440×900, 1600×1200, 1680×1050, 1680×1200, 1920×1080, 1920×1200, 1920×1440, 2560×1440

Strawberry Fields

Designed by Nathalie Ouederni from France.

Strawberry Fields

preview
without calendar: 320×480, 1024×768, 1280×1024, 1440×900, 1680×1200, 1920×1200, 2560×1440

Fishing Is My Passion!

“The month of June is a wonderful time to go fishing, the most soothing and peaceful activity.” — Designed by Igor Izhik from Canada.

Fishing Is My Passion!

preview
without calendar: 320×480, 640×480, 800×480, 800×600, 1024×768, 1024×1024, 1152×864, 1280×720, 1280×800, 1280×960, 1280×1024, 1400×1050, 1440×900, 1600×1200, 1680×1200, 1920×1080, 1920×1200, 1920×1440, 2560×1440

Summer Time

“Summer is coming so I made this simple pattern with all my favorite summer things.” — Designed by Maria Keller from Mexico.

Summer Time

preview
without calendar: 320×480, 640×480, 640×1136, 750×1334, 800×480, 800×600, 1024×768, 1024×1024, 1152×864, 1242×2208, 1280×720, 1280×800, 1280×960, 1280×1024, 1366×768, 1400×1050, 1440×900, 1600×1200, 1680×1050, 1680×1200, 1920×1080, 1920×1200, 1920×1440, 2560×1440, 2880×1800

The Amazing Water Park

“Summer is coming. And it’s going to be like an amazing water park, full of stunning encounters.” — Designed by Netzbewegung / Mario Metzger from Germany.

The Amazing Water Park

preview
without calendar: 320×480, 640×480, 800×600, 1024×768, 1024×1024, 1152×864, 1280×720, 1280×800, 1280×960, 1280×1024, 1366×768, 1400×1050, 1440×900, 1600×1200, 1680×1050, 1680×1200, 1920×1080, 1920×1200, 1920×1440, 2560×1440

Gravity

Designed by Elise Vanoorbeek (Doud Design) from Belgium.

Gravity

preview
without calendar: 1024×768, 1024×1024, 1152×864, 1280×720, 1280×800, 1280×960, 1280×1024, 1366×768, 1400×1050, 1440×900, 1600×1200, 1680×1050, 1680×1200, 1920×1080, 1920×1200, 1920×1440, 2560×1440

Periodic Table Of HTML5 Elements

“We wanted an easy reference guide to help navigate through HTML5 and that could be updateable” — Designed by Castus from the UK.

Periodic Table Of HTML5 Elements

preview
without calendar: 1024×768, 1280×800, 1280×1024, 1366×768, 1440×900, 1600×900, 1600×1200, 1920×1080, 1920×1200, 2560×1440

Ice Creams Away!

“Summer is taking off with some magical ice cream hot air balloons.” — Designed by Sasha Endoh from Canada

Ice Creams Away!

preview
without calendar: 320×480, 1024×768, 1152×864, 1280×800, 1280×960, 1400×1050, 1440×900, 1600×1200, 1680×1050, 1920×1080, 1920×1200, 2560×1440

Lavender Is In The Air!

“June always reminds me of lavender — it just smells wonderful and fresh. For this wallpaper I wanted to create a simple, yet functional design that featured… you guessed it… lavender!” — Designed by Jon Phillips from Canada.

Lavender Is In The Air!

preview
without calendar: 320×480, 640×480, 800×480, 800×600, 1024×768, 1024×1024, 1152×864, 1280×720, 1280×800, 1280×960, 1280×1024, 1400×1050, 1440×900, 1600×1200, 1680×1050, 1680×1200, 1920×1080, 1920×1200, 1920×1440, 2560×1440

Ice Cream June

“For me, June always marks the beginning of summer! The best way to celebrate summer is of course ice cream, what else?” — Designed by Tatiana Anagnostaki from Greece.

Ice cream June

preview
without calendar: 1024×768, 1280×1024, 1440×900, 1680×1050, 1680×1200, 1920×1440, 2560×1440

Join In Next Month!

Please note that we respect and carefully consider the ideas and motivation behind each and every artist’s work. This is why we give all artists the full freedom to explore their creativity and express emotions and experience throughout their works. This is also why the themes of the wallpapers weren’t anyhow influenced by us, but rather designed from scratch by the artists themselves.

Thank you to all designers for their participation. Join in next month!

How to Build Self-Hosted (Private) Cloud For Free

Original Source: https://www.hongkiat.com/blog/build-private-cloud-for-free-using-nextcloud/

Detailed look at Nextcloud that allows you to create your own reliable and free cloud storage.

The post How to Build Self-Hosted (Private) Cloud For Free appeared first on Hongkiat.

Visit hongkiat.com for full content.

Building A Central Logging Service In-House

Original Source: https://www.smashingmagazine.com/2018/05/building-central-logging-service/

Building A Central Logging Service In-House

Building A Central Logging Service In-House

Akhil Labudubariki

2018-05-30T13:30:22+02:00
2018-05-30T12:20:54+00:00

We all know how important debugging is for improving application performance and features. BrowserStack runs one million sessions a day on a highly distributed application stack! Each involves several moving parts, as a client’s single session can span multiple components across several geographic regions.

Without the right framework and tools, the debugging process can be a nightmare. In our case, we needed a way to collect events happening during different stages of each process in order to get an in-depth understanding of everything taking place during a session. With our infrastructure, solving this problem became complicated as each component might have multiple events from their lifecycle of processing a request.

That’s why we developed our own in-house Central Logging Service tool (CLS) to record all important events logged during a session. These events help our developers identify conditions where something goes wrong in a session and helps keep track of certain key product metrics.

Debugging data ranges from simple things like API response latency to monitoring a user’s network health. In this article, we share our story of building our CLS tool which collects 70G of relevant chronological data per day from 100+ components reliably, at scale and with two M3.large EC2 instances.

Getting the process just right ain’t an easy task. That’s why we’ve set up ‘this-is-how-I-work’-sessions — with smart cookies sharing what works really well for them. A part of the Smashing Membership, of course.

Explore features →

Smashing TV, with live sessions for professional designers and developers.

The Decision To Build In-House

First, let’s consider why we built our CLS tool in-house rather than used an existing solution. Each of our sessions sends 15 events on average, from multiple components to the service – translating into approximately 15 million total events per day.

Our service needed the ability to store all this data. We sought a complete solution to support event storing, sending and querying across events. As we considered third-party solutions such as Amplitude and Keen, our evaluation metrics included cost, performance in handling high parallel requests and ease of adoption. Unfortunately, we could not find a fit that met all our requirements within budget – although benefits would have included saving time and minimizing alerts. While it would take additional effort, we decided to develop an in-house solution ourselves.

Building in-house

One of the biggest issues with building In-house is the amount of resources that we need to spend to maintain it. (Image credit: Source: Digiday)

Technical Details

In terms of architecting for our component, we outlined the following basic requirements:

Client Performance
Does not impact the performance of the client/component sending the events.
Scale
Able to handle a high number of requests in parallel.
Service performance
Quick to process all events being sent to it.
Insight into data
Each event logged needs to have some meta information to be able to uniquely identify the component or user, account or message and give more information to help the developer debug faster.
Queryable interface
Developers can query all events for a particular session, helping to debug a particular session, build component health reports, or generate meaningful performance statistics of our systems.
Faster and easier adoption
Easy integration with an existing or new component without burdening teams and taking up their resources.
Low maintenance
We are a small engineering team, so we sought a solution to minimize alerts!

Building Our CLS Solution

Decision 1: Choosing An Interface To Expose

In developing CLS, we obviously didn’t want to lose any of our data, but we didn’t want component performance to take a hit either. Not to mention the additional factor of preventing existing components from becoming more complicated, since it would delay overall adoption and release. In determining our interface, we considered the following choices:

Storing events in local Redis in each component, as a background processor pushes it to CLS. However, this requires a change in all components, along with an introduction of Redis for components which didn’t already contain it.
A Publisher – Subscriber model, where Redis is closer to the CLS. As everyone publishes events, again we have the factor of components running across the globe. During the time of high-traffic, this would delay components. Further, this write could intermittently jump up to five seconds (due to the internet alone).
Sending events over UDP, which offers a lesser impact on application performance. In this case data would be sent and forgotten, however, the disadvantage here would be data loss.

Interestingly, our data loss over UDP was less than 0.1 percent, which was an acceptable amount for us to consider building such a service. We were able to convince all teams that this amount of loss was worth the performance, and went ahead to leverage a UDP interface that listened to all events being sent.

While one result was a smaller impact on an application’s performance, we did face an issue as UDP traffic was not allowed from all networks, mostly from our users’ – causing us in some cases to receive no data at all. As a workaround, we supported logging events using HTTP requests. All events coming from the user’s side would be sent via HTTP, whereas all events being recorded from our components would be via UDP.

Decision 2: Tech Stack (Language, Framework & Storage)

We are a Ruby shop. However, we were uncertain if Ruby would be a better choice for our particular problem. Our service would have to handle a lot of incoming requests, as well as process a lot of writes. With the Global Interpreter lock, achieving multithreading or concurrency would be difficult in Ruby (please don’t take offense – we love Ruby!). So we needed a solution that would help us achieve this kind of concurrency.

We were also keen to evaluate a new language in our tech stack, and this project seemed perfect for experimenting with new things. That’s when we decided to give Golang a shot since it offered inbuilt support for concurrency and lightweight threads and go-routines. Each logged data point resembles a key-value pair where ‘key’ is the event and ‘value’ serves as its associated value.

But having a simple key and value is not enough to retrieve a session related data – there is more metadata to it. To address this, we decided any event needing to be logged would have a session ID along with its key and value. We also added extra fields like timestamp, user ID and the component logging the data, so that it became more easy to fetch and analyze data.

Now that we decided on our payload structure, we had to choose our datastore. We considered Elastic Search, but we also wanted to support update requests for keys. This would trigger the entire document to be re-indexed, which might affect the performance of our writes. MongoDB made more sense as a datastore since it would be easier to query all events based on any of the data fields that would be added. This was easy!

Decision 3: DB Size Is Huge And Query And Archiving Sucks!

In order to cut maintenance, our service would have to handle as many events as possible. Given the rate that BrowserStack releases features and products, we were certain the number of our events would increase at higher rates over time, meaning our service would have to continue to perform well. As space increases, reads and writes take more time – which could be a huge hit on the service’s performance.

The first solution we explored was moving logs from a certain period away from the database (in our case, we decided on 15 days). To do this, we created a different database for each day, allowing us to find logs older than a particular period without having to scan all written documents. Now we continually remove databases older than 15 days from Mongo, while of course keeping backups just in case.

The only leftover piece was a developer interface to query session-related data. Honestly, this was the easiest problem to solve. We provide an HTTP interface, where people can query for session related events in the corresponding database in the MongoDB, for any data having a particular session ID.

Architecture

Let’s talk about the internal components of the service, considering the following points:

As previously discussed, we needed two interfaces – one listening over UDP and another listening over HTTP. So we built two servers, again one for each interface, to listen for events. As soon as an event arrives, we parse it to check whether it has the required fields – these are session ID, key, and value. If it does not, the data is dropped. Otherwise, the data is passed over a Go channel to another goroutine, whose sole responsibility is to write to the MongoDB.
A possible concern here is writing to the MongoDB. If writes to the MongoDB are slower than the rate data is received, this creates a bottleneck. This, in turn, starves other incoming events and means dropped data. The server, therefore, should be fast in processing incoming logs and be ready to process ones upcoming. To address the issue, we split the server into two parts: the first receives all events and queues them up for the second, which processes and writes them into the MongoDB.
For queuing we chose Redis. By dividing the entire component into these two pieces we reduced the server’s workload, giving it room to handle more logs.
We wrote a small service using Sinatra server to handle all the work of querying MongoDB with given parameters. It returns an HTML/JSON response to developers when they need information on a particular session.

All these processes happily run on a single m3.large instance.

CLS v1

CLS v1: A representation of the system’s first architecture. All the components are running on one single machine.

Feature Requests

As our CLS tool saw more use over time, it needed more features. Below, we discuss these and how they were added.

Missing Metadata

Gradually as the number of components in BrowserStack increases, we’ve demanded more from CLS. For example, we needed the ability to log events from components lacking a session ID. Otherwise obtaining one would burden our infrastructure, in the form of affecting application performance and incurring traffic on our main servers.

We addressed this by enabling event logging using other keys, such as terminal and user IDs. Now whenever a session is created or updated, CLS is informed with the session ID, as well as the respective user and terminal IDs. It stores a map that can be retrieved by the process of writing to MongoDB. Whenever an event that contains either the user or terminal ID is retrieved, the session ID is added.

Handle Spamming (Code Issues In Other Components)

CLS also faced the usual difficulties with handling spam events. We often found deploys in components that generated a huge volume of requests sent to CLS. Other logs would suffer in the process, as the server became too busy to process these and important logs were dropped.

For the most part, most of the data being logged were via HTTP requests. To control them we enable rate limiting on nginx (using the limit_req_zone module), which blocks requests from any IP we found hitting requests more than a certain number in a small amount of time. Of course, we do leverage health reports on all blocked IPs and inform the responsible teams.

Scale v2

As our sessions per day increased, data being logged to CLS was also increasing. This affected the queries our developers were running daily, and soon the bottleneck we had was with the machine itself. Our setup consisted of two core machines running all of the above components, along with a bunch of scripts to query Mongo and keep track of key metrics for each product. Over time, data on the machine had increased heavily and scripts began to take a lot of CPU time. Even after trying to optimizing Mongo queries, we always came back to the same issues.

To solve this, we added another machine for running health report scripts and the interface to query these sessions. The process involved booting a new machine and setting up a slave of the Mongo running on the main machine. This has helped reduce the CPU spikes we saw every day caused by these scripts.

CLS v2

CLS v2: A representation of the current system’s architecture. Logs are written to the master machine and they are synced on the slave machine. Developer’s queries run on the slave machine.

Conclusion

Building a service for a task as simple as data logging can get complicated, as the amount of data increases. This article discusses the solutions we explored, along with challenges faced while solving this problem. We experimented with Golang to see how well it would fit with our ecosystem, and so far we have been satisfied. Our choice to create an internal service rather than paying for an external one has been wonderfully cost-efficient. We also didn’t have to scale our setup to another machine until much later – when the volume of our sessions increased. Of course, our choices in developing CLS were completely based on our requirements and priorities.

Today CLS handles up to 15 million events every day, constituting up to 70 GB of data. This data is being used to help us solve any issues our customers face during any session. We also use this data for other purposes. Given the insights each session’s data provides on different products and internal components, we’ve begun leveraging this data to keep track of each product. This is achieved by extracting the key metrics for all the important components.

All in all, we’ve seen great success in building our own CLS tool. If it makes sense for you, I recommend you consider doing the same!

Smashing Editorial
(rb, ra, il)

Using ES Modules in the Browser Today

Original Source: https://www.sitepoint.com/using-es-modules/

This article will show you how you can use ES modules in the browser today.

Until recently, JavaScript had no concept of modules. It wasn’t possible to directly reference or include one JavaScript file in another. And as applications grew in size and complexity, this made writing JavaScript for the browser tricky.

One common solution is to load arbitrary scripts in a web page using <script> tags. However, this brings its own problems. For example, each script initiates a render-blocking HTTP request, which can make JS-heavy pages feel sluggish and slow. Dependency management also becomes complicated, as load order matters.

ES6 (ES2015) went some way to addressing this situation by introducing a single, native module standard. (You can read more about ES6 modules here.) However, as browser support for ES6 modules was initially poor, people started using module loaders to bundle dependencies into a single ES5 cross-browser compatible file. This process introduces its own issues and degree of complexity.

But good news is at hand. Browser support is getting ever better, so let’s look at how you can use ES6 modules in today’s browsers.

The Current ES Modules Landscape

Safari, Chrome, Firefox and Edge all support the ES6 Modules import syntax (Firefox behind a flag), here’s what they look like.

<script type=”module”>
import { tag } from ‘./html.js’

const h1 = tag(‘h1’, ‘? Hello Modules!’)
document.body.appendChild(h1)
</script>

// html.js
export function tag (tag, text) {
const el = document.createElement(tag)
el.textContent = text

return el
}

Or as an external script:

<script type=”module” src=”app.js”></script>

// app.js
import { tag } from ‘./html.js’

const h1 = tag(‘h1’, ‘? Hello Modules!’)
document.body.appendChild(h1)

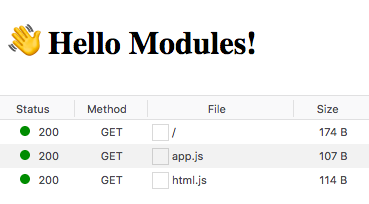
Simply add type=”module” to your script tags and the browser will load them as ES Modules. The browser will follow all import paths, downloading and executing each module only once.

ES modules: Network graph showing loading

Older browsers won’t execute scripts with an unknown “type”, but you can define fallback scripts with the nomodule attribute:

<script type=”module” src=”module.js”></script>
<script nomodule src=”fallback.js”></script>

Continue reading %Using ES Modules in the Browser Today%

Overflow – Turn Your Designs into Playable User Flow Diagrams That Tell a Story

Original Source: https://www.webdesignerdepot.com/2018/05/overflow-turn-your-designs-into-playable-user-flow-diagrams-that-tell-a-story/

Designing the best user flow for your product is definitely not an easy task. It requires several iterations before getting it right. Creating and updating user flow diagrams has largely been considered a painful process for designers, with many of them skipping it entirely because of this. Presenting user flows to stakeholders and actually getting them to understand and follow the user’s journey might actually be the most challenging part.
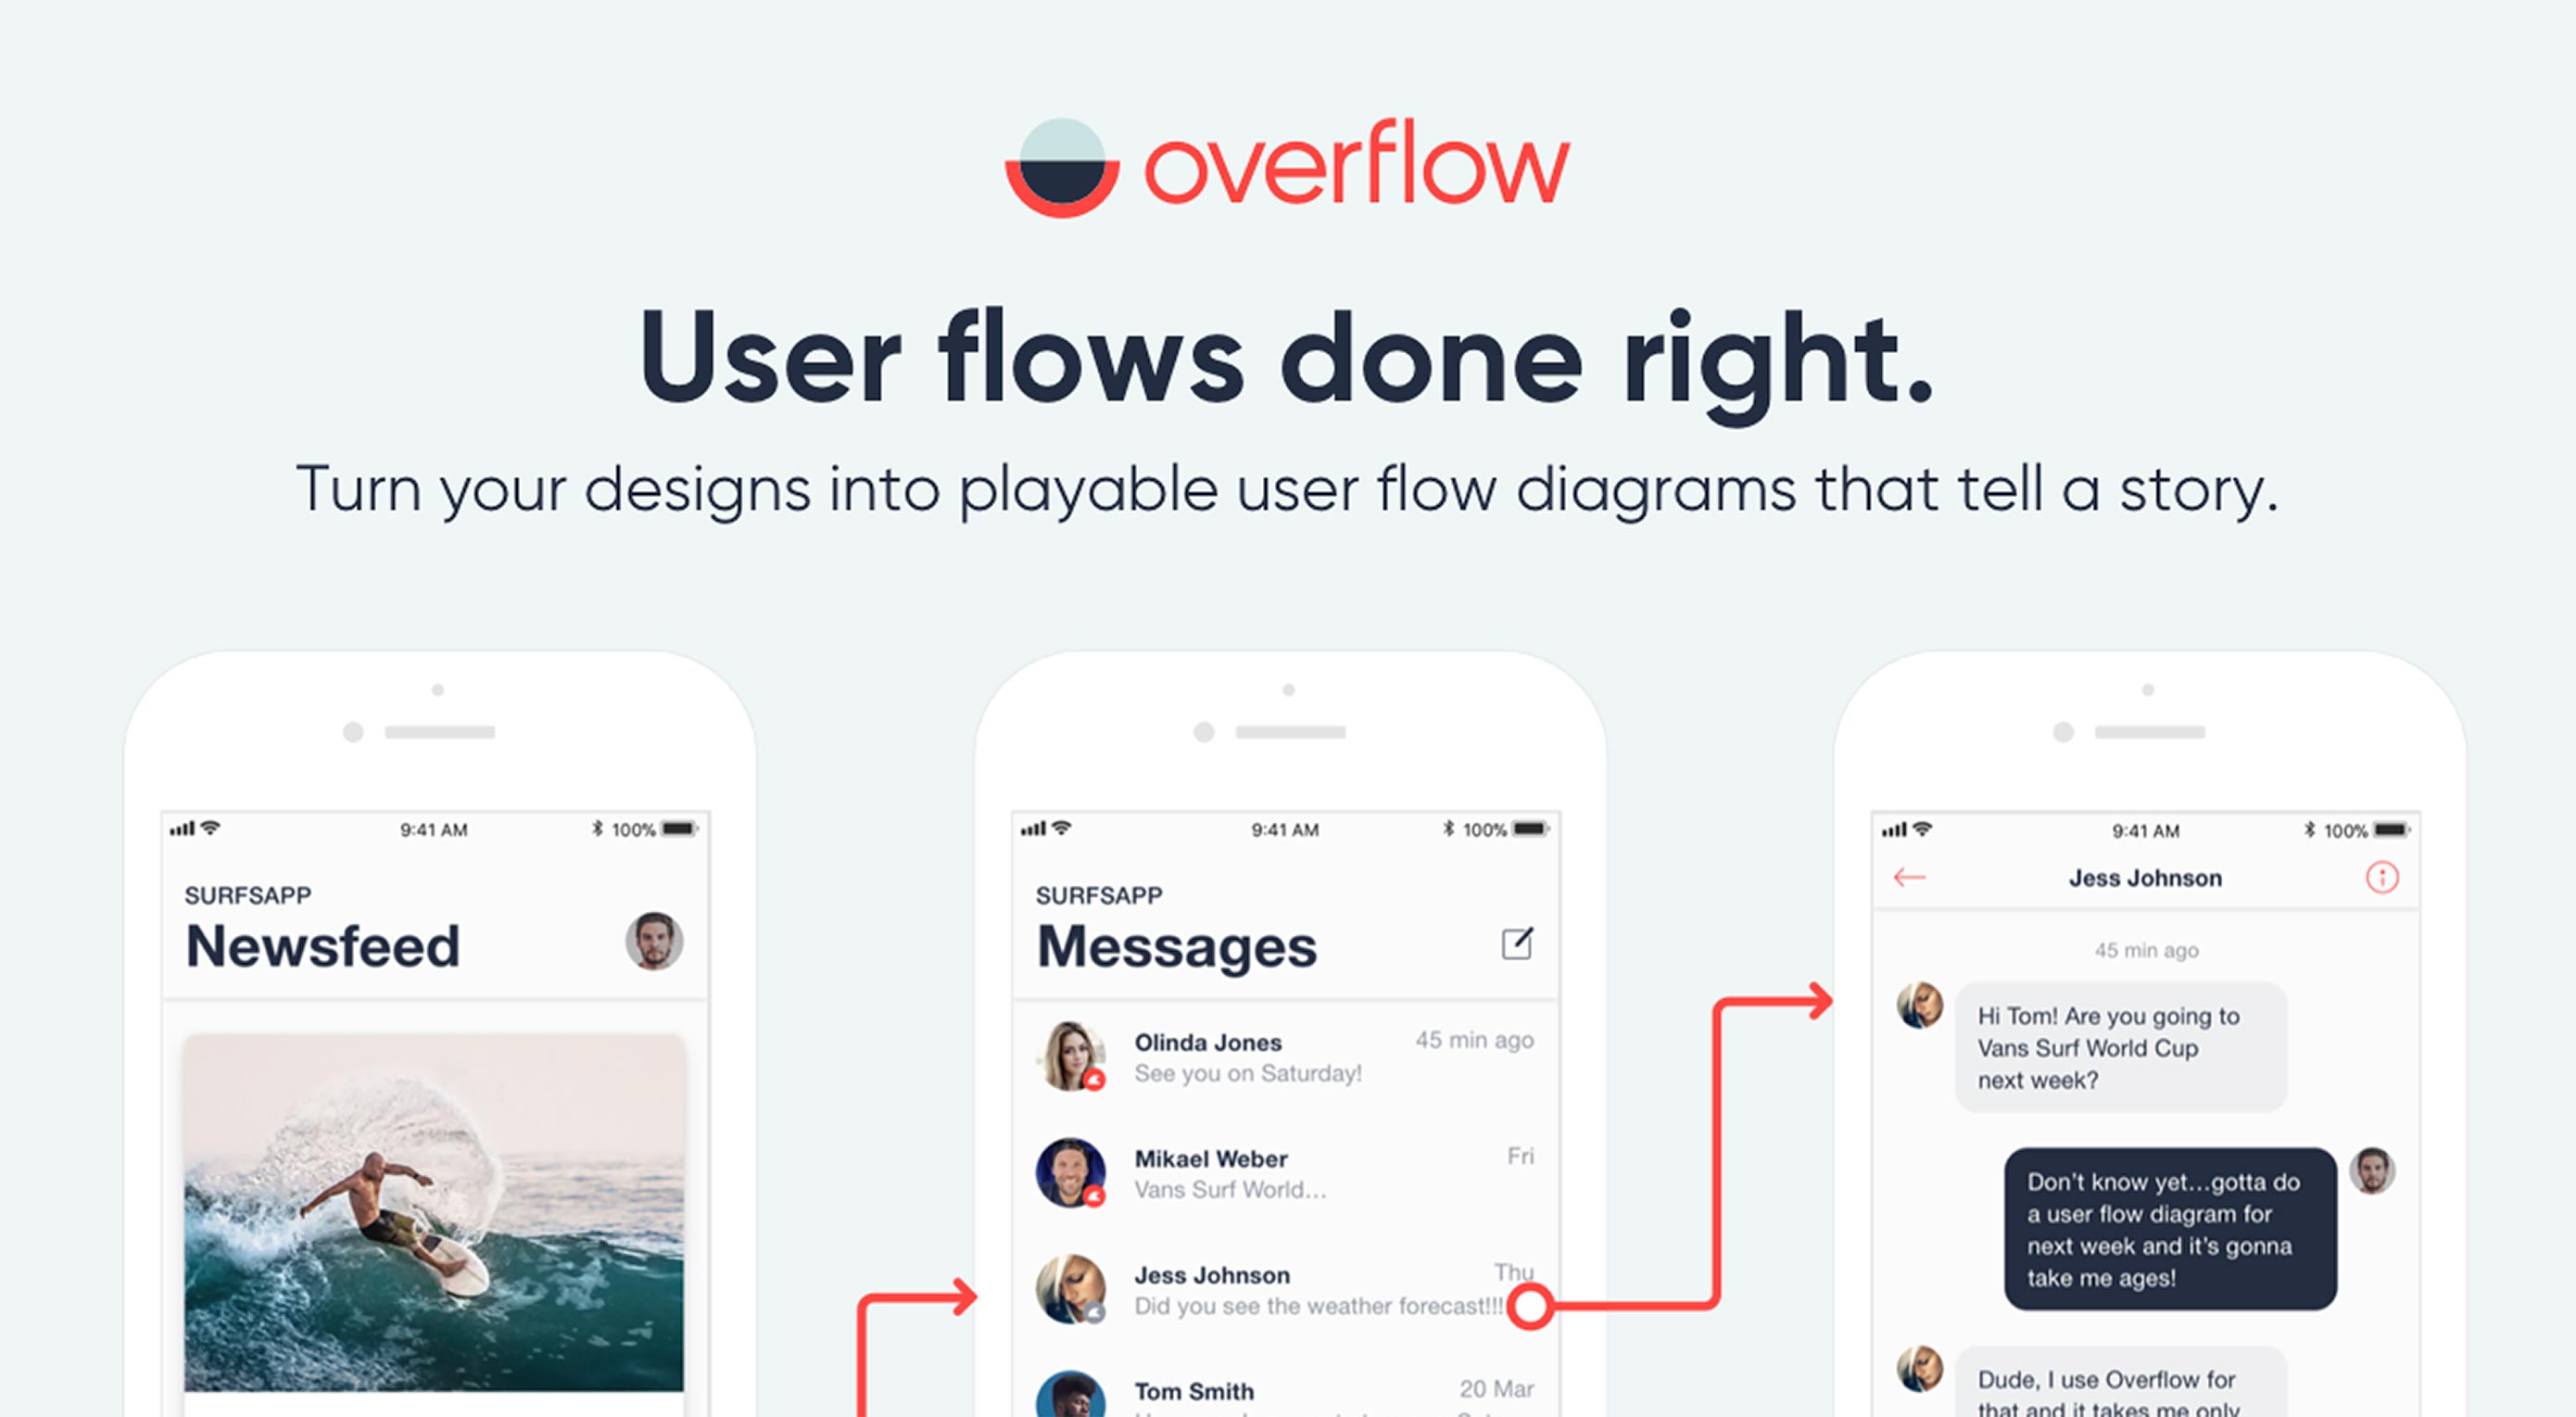
Overflow helps you do exactly that. It empowers you to effectively communicate your work, while fully engaging your audience with an interactive user flow presentation.

Create User Flows in Minutes

Creating user flow diagrams with Overflow is a quick and enjoyable experience. You can connect and sync Overflow with your favorite design tool, maintaining all your layers and artboards. Easily drag magnets to create your connectors, add text, shapes and images to enrich your presentation. Customize the look using styles and themes to create a fully custom branded presentation that fits your designs and audience.

Present Your Designs

Presenting your designs with Overflow, will always make you look good. You can present your designs with an interactive flow presentation, navigating through your entire flow using arrow keys or clicking on the connectors. Show the big picture with a bird’s eye view of your flow, or zoom in to focus on specific details. If you want to present your flow screen by screen you can easily switch to the out of the box rapid prototype mode.

Share to Get Valuable Feedback

Share your user flow diagrams on Overflow Cloud and let your audience experience a magical journey on their web browser or mobile device. Export in PDF, PNG, or print your user flows and stick on walls.

So far more than 35,000 designers have tried Overflow, and they loved it. Overflow is currently in public beta and available to download, for free.

Add Realistic Chalk and Sketch Lettering Effects with Sketch’it – only $5!

Source

p img {display:inline-block; margin-right:10px;}
.alignleft {float:left;}
p.showcase {clear:both;}
body#browserfriendly p, body#podcast p, div#emailbody p{margin:0;}

Keeping Node.js Fast: Tools, Techniques, And Tips For Making High-Performance Node.js Servers

Original Source: https://www.smashingmagazine.com/2018/06/nodejs-tools-techniques-performance-servers/

Keeping Node.js Fast: Tools, Techniques, And Tips For Making High-Performance Node.js Servers

Keeping Node.js Fast: Tools, Techniques, And Tips For Making High-Performance Node.js Servers

David Mark Clements

2018-06-07T13:45:51+02:00
2018-06-07T12:12:00+00:00

If you’ve been building anything with Node.js for long enough, then you’ve no doubt experienced the pain of unexpected speed issues. JavaScript is an evented, asynchronous language. That can make reasoning about performance tricky, as will become apparent. The surging popularity of Node.js has exposed the need for tooling, techniques and thinking suited to the constraints of server-side JavaScript.

When it comes to performance, what works in the browser doesn’t necessarily suit Node.js. So, how do we make sure a Node.js implementation is fast and fit for purpose? Let’s walk through a hands-on example.

Tools

Node is a very versatile platform, but one of the predominant applications is creating networked processes. We’re going to focus on profiling the most common of these: HTTP web servers.

We’ll need a tool that can blast a server with lots of requests while measuring the performance. For example, we can use AutoCannon:

npm install -g autocannon

Other good HTTP benchmarking tools include Apache Bench (ab) and wrk2, but AutoCannon is written in Node, provides similar (or sometimes greater) load pressure, and is very easy to install on Windows, Linux, and Mac OS X.

Nope, we can’t do any magic tricks, but we have articles, books and webinars featuring techniques we all can use to improve our work. Smashing Members get a seasoned selection of magic front-end tricks — e.g. live designing sessions and perf audits, too. Just sayin’! 😉

Explore Smashing Wizardry →

Smashing Cat, just preparing to do some magic stuff.

After we’ve established a baseline performance measurement, if we decide our process could be faster we’ll need some way to diagnose problems with the process. A great tool for diagnosing various performance issues is Node Clinic, which can also be installed with npm:

npm –install -g clinic

This actually installs a suite of tools. We’ll be using Clinic Doctor and Clinic Flame (a wrapper around 0x) as we go.

Note: For this hands-on example we’ll need Node 8.11.2 or higher.

The Code

Our example case is a simple REST server with a single resource: a large JSON payload exposed as a GET route at /seed/v1. The server is an app folder which consists of a package.json file (depending on restify 7.1.0), an index.js file and a util.js file.

The index.js file for our server looks like so:

‘use strict’

const restify = require(‘restify’)
const { etagger, timestamp, fetchContent } = require(‘./util’)()
const server = restify.createServer()

server.use(etagger().bind(server))

server.get(‘/seed/v1’, function (req, res, next) {
fetchContent(req.url, (err, content) => {
if (err) return next(err)
res.send({data: content, url: req.url, ts: timestamp()})
next()
})
})

server.listen(3000)

This server is representative of the common case of serving client-cached dynamic content. This is achieved with the etagger middleware, which calculates an ETag header for the latest state of the content.

The util.js file provides implementation pieces that would commonly be used in such a scenario, a function to fetch the relevant content from a backend, the etag middleware and a timestamp function that supplies timestamps on a minute-by-minute basis:

‘use strict’

require(‘events’).defaultMaxListeners = Infinity
const crypto = require(‘crypto’)

module.exports = () => {
const content = crypto.rng(5000).toString(‘hex’)
const ONE_MINUTE = 60000
var last = Date.now()

function timestamp () {
var now = Date.now()
if (now — last >= ONE_MINUTE) last = now
return last
}

function etagger () {
var cache = {}
var afterEventAttached = false
function attachAfterEvent (server) {
if (attachAfterEvent === true) return
afterEventAttached = true
server.on(‘after’, (req, res) => {
if (res.statusCode !== 200) return
if (!res._body) return
const key = crypto.createHash(‘sha512’)
.update(req.url)
.digest()
.toString(‘hex’)
const etag = crypto.createHash(‘sha512’)
.update(JSON.stringify(res._body))
.digest()
.toString(‘hex’)
if (cache[key] !== etag) cache[key] = etag
})
}
return function (req, res, next) {
attachAfterEvent(this)
const key = crypto.createHash(‘sha512’)
.update(req.url)
.digest()
.toString(‘hex’)
if (key in cache) res.set(‘Etag’, cache[key])
res.set(‘Cache-Control’, ‘public, max-age=120’)
next()
}
}

function fetchContent (url, cb) {
setImmediate(() => {
if (url !== ‘/seed/v1’) cb(Object.assign(Error(‘Not Found’), {statusCode: 404}))
else cb(null, content)
})
}

return { timestamp, etagger, fetchContent }

}

By no means take this code as an example of best practices! There are multiple code smells in this file, but we’ll locate them as we measure and profile the application.

To get the full source for our starting point, the slow server can be found over here.

Profiling

In order to profile, we need two terminals, one for starting the application, and the other for load testing it.

In one terminal, within the app, folder we can run:

node index.js

In another terminal we can profile it like so:

autocannon -c100 localhost:3000/seed/v1

This will open 100 concurrent connections and bombard the server with requests for ten seconds.

The results should be something similar to the following (Running 10s test @ http://localhost:3000/seed/v1 — 100 connections):

Stat
Avg
Stdev
Max

Latency (ms)
3086.81
1725.2
5554

Req/Sec
23.1
19.18
65

Bytes/Sec
237.98 kB
197.7 kB
688.13 kB

231 requests in 10s, 2.4 MB read

Results will vary depending on the machine. However, considering that a “Hello World” Node.js server is easily capable of thirty thousand requests per second on that machine that produced these results, 23 requests per second with an average latency exceeding 3 seconds is dismal.

Diagnosing

Discovering The Problem Area

We can diagnose the application with a single command, thanks to Clinic Doctor’s –on-port command. Within the app folder we run:

clinic doctor –on-port=’autocannon -c100 localhost:$PORT/seed/v1’ — node index.js

This will create an HTML file that will automatically open in our browser when profiling is complete.

The results should look something like the following:

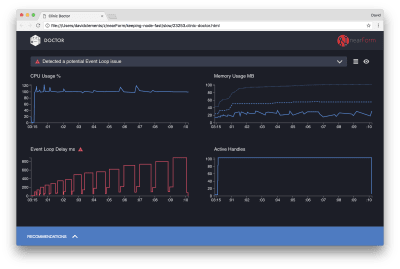
Clinic Doctor has detected an Event Loop issue

Clinic Doctor results

The Doctor is telling us that we have probably had an Event Loop issue.

Along with the message near the top of the UI, we can also see that the Event Loop chart is red, and shows a constantly increasing delay. Before we dig deeper into what this means, let’s first understand the effect the diagnosed issue is having on the other metrics.

We can see the CPU is consistently at or above 100% as the process works hard to process queued requests. Node’s JavaScript engine (V8) actually uses two CPU cores. One for the Event Loop and the other for Garbage Collection. When we see the CPU spiking up to 120% in some cases, the process is collecting objects related to handled requests.

We see this correlated in the Memory graph. The solid line in the Memory chart is the Heap Used metric. Any time there’s a spike in CPU we see a fall in the Heap Used line, showing that memory is being deallocated.

Active Handles are unaffected by the Event Loop delay. An active handle is an object that represents either I/O (such as a socket or file handle) or a timer (such as a setInterval). We instructed AutoCannon to open 100 connections (-c100). Active handles stay a consistent count of 103. The other three are handles for STDOUT, STDERR, and the handle for the server itself.

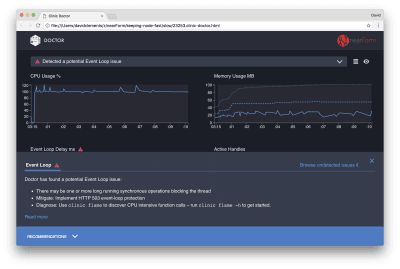
If we click the Recommendations panel at the bottom of the screen, we should see something like the following:

Clinic Doctor recommendations panel opened

Viewing issue specific recommendations

Short-Term Mitigation

Root cause analysis of serious performance issues can take time. In the case of a live deployed project, it’s worth adding overload protection to servers or services. The idea of overload protection is to monitor event loop delay (among other things), and respond with “503 Service Unavailable” if a threshold is passed. This allows a load balancer to fail over to other instances, or in the worst case means users will have to refresh. The overload-protection module can provide this with minimum overhead for Express, Koa, and Restify. The Hapi framework has a load configuration setting which provides the same protection.

Understanding The Problem Area

As the short explanation in Clinic Doctor explains, if the Event Loop is delayed to the level that we’re observing it’s very likely that one or more functions are “blocking” the Event Loop.

It’s especially important with Node.js to recognize this primary JavaScript characteristic: asynchronous events cannot occur until currently executing code has completed.

This is why a setTimeout cannot be precise.

For instance, try running the following in a browser’s DevTools or the Node REPL:

console.time(‘timeout’)
setTimeout(console.timeEnd, 100, ‘timeout’)
let n = 1e7
while (n–) Math.random()

The resulting time measurement will never be 100ms. It will likely be in the range of 150ms to 250ms. The setTimeout scheduled an asynchronous operation (console.timeEnd), but the currently executing code has not yet complete; there are two more lines. The currently executing code is known as the current “tick.” For the tick to complete, Math.random has to be called ten million times. If this takes 100ms, then the total time before the timeout resolves will be 200ms (plus however long it takes the setTimeout function to actually queue the timeout beforehand, usually a couple of milliseconds).

In a server-side context, if an operation in the current tick is taking a long time to complete requests cannot be handled, and data fetching cannot occur because asynchronous code will not be executed until the current tick has completed. This means that computationally expensive code will slow down all interactions with the server. So it’s recommended to split out resource intense work into separate processes and call them from the main server, this will avoid cases where on rarely used but expensive route slows down the performance of other frequently used but inexpensive routes.

The example server has some code that is blocking the Event Loop, so the next step is to locate that code.

Analyzing

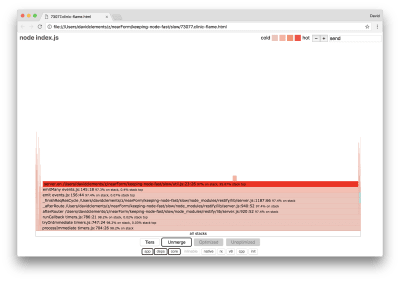
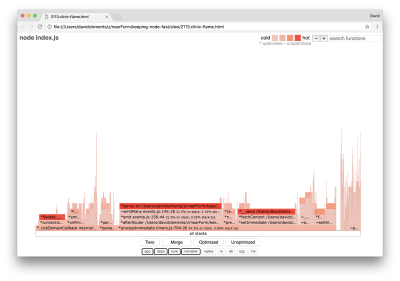
One way to quickly identify poorly performing code is to create and analyze a flame graph. A flame graph represents function calls as blocks sitting on top of each other — not over time but in aggregate. The reason it’s called a ‘flame graph’ is because it typically uses an orange to red color scheme, where the redder a block is the “hotter” a function is, meaning, the more it’s likely to be blocking the event loop. Capturing data for a flame graph is conducted through sampling the CPU — meaning that a snapshot of the function that is currently being executed and it’s stack is taken. The heat is determined by the percentage of time during profiling that a given function is at the top of the stack (e.g. the function currently being executed) for each sample. If it’s not the last function to ever be called within that stack, then it’s likely to be blocking the event loop.

Let’s use clinic flame to generate a flame graph of the example application:

clinic flame –on-port=’autocannon -c100 localhost:$PORT/seed/v1’ — node index.js

The result should open in our browser with something like the following:

Clinic’s flame graph shows that server.on is the bottleneck

Clinic’s flame graph visualization

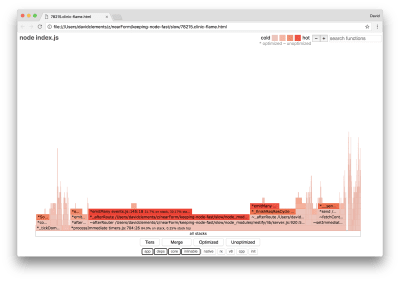
The width of a block represents how much time it spent on CPU overall. Three main stacks can be observed taking up the most time, all of them highlighting server.on as the hottest function. In truth, all three stacks are the same. They diverge because during profiling optimized and unoptimized functions are treated as separate call frames. Functions prefixed with a * are optimized by the JavaScript engine, and those prefixed with a ~ are unoptimized. If the optimized state isn’t important to us, we can simplify the graph further by pressing the Merge button. This should lead to view similar to the following:

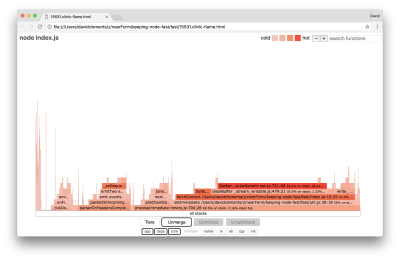
Merged flame graph

Merging the flame graph

From the outset, we can infer that the offending code is in the util.js file of the application code.

The slow function is also an event handler: the functions leading up to the function are part of the core events module, and server.on is a fallback name for an anonymous function provided as an event handling function. We can also see that this code isn’t in the same tick as code that actually handles the request. If there were functions in the core, http, net, and stream would be in the stack.

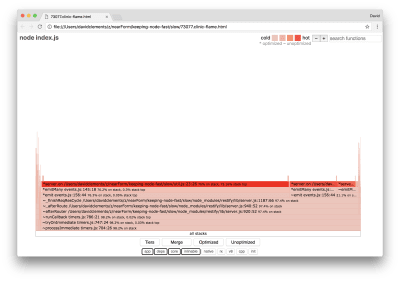
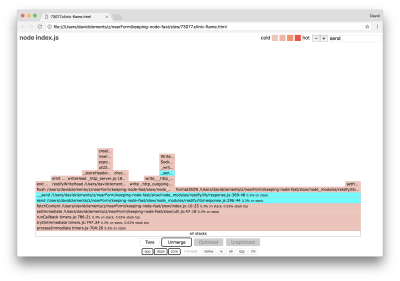
Such core functions can be found by expanding other, much smaller, parts of the flame graph. For instance, try using the search input on the top right of the UI to search for send (the name of both restify and http internal methods). It should be on the right of the graph (functions are alphabetically sorted):

Flame graph has two small blocks highlighted which represent HTTP processing function

Searching the flame graph for HTTP processing functions

Notice how comparatively small all the actual HTTP handling blocks are.

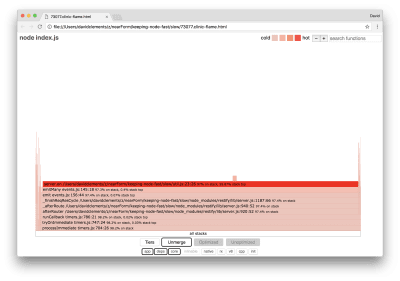
We can click one of the blocks highlighted in cyan which will expand to show functions like writeHead and write in the http_outgoing.js file (part of Node core http library):

Flame graph has zoomed into a different view showing HTTP related stacks

Expanding the flame graph into HTTP relevant stacks

We can click all stacks to return to the main view.

The key point here is that even though the server.on function isn’t in the same tick as the actual request handling code, it’s still affecting the overall server performance by delaying the execution of otherwise performant code.

Debugging

We know from the flame graph that the problematic function is the event handler passed to server.on in the util.js file.

Let’s take a look:

server.on(‘after’, (req, res) => {
if (res.statusCode !== 200) return
if (!res._body) return
const key = crypto.createHash(‘sha512’)
.update(req.url)
.digest()
.toString(‘hex’)
const etag = crypto.createHash(‘sha512’)
.update(JSON.stringify(res._body))
.digest()
.toString(‘hex’)
if (cache[key] !== etag) cache[key] = etag
})

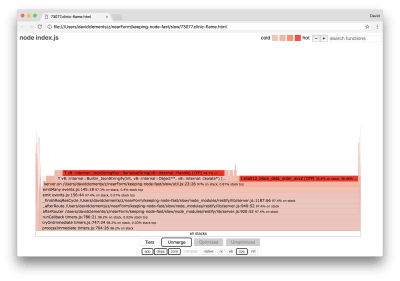
It’s well known that cryptography tends to be expensive, as does serialization (JSON.stringify) but why don’t they appear in the flame graph? These operations are in the captured samples, but they’re hidden behind the cpp filter. If we press the cpp button we should see something like the following:

Additional blocks related to C++ have been revealed in the flame graph (main view)

Revealing serialization and cryptography C++ frames

The internal V8 instructions relating to both serialization and cryptography are now shown as the hottest stacks and as taking up most of the time. The JSON.stringify method directly calls C++ code; this is why we don’t see a JavaScript function. In the cryptography case, functions like createHash and update are in the data, but they are either inlined (which means they disappear in the merged view) or too small to render.

Once we start to reason about the code in the etagger function it can quickly become apparent that it’s poorly designed. Why are we taking the server instance from the function context? There’s a lot of hashing going on, is all of that necessary? There’s also no If-None-Match header support in the implementation which would mitigate some of the load in some real-world scenarios because clients would only make a head request to determine freshness.

Let’s ignore all of these points for the moment and validate the finding that the actual work being performed in server.on is indeed the bottleneck. This can be achieved by setting the server.on code to an empty function and generating a new flamegraph.

Alter the etagger function to the following:

function etagger () {
var cache = {}
var afterEventAttached = false
function attachAfterEvent (server) {
if (attachAfterEvent === true) return
afterEventAttached = true
server.on(‘after’, (req, res) => {})
}
return function (req, res, next) {
attachAfterEvent(this)
const key = crypto.createHash(‘sha512’)
.update(req.url)
.digest()
.toString(‘hex’)
if (key in cache) res.set(‘Etag’, cache[key])
res.set(‘Cache-Control’, ‘public, max-age=120’)
next()
}
}

The event listener function passed to server.on is now a no-op.

Let’s run clinic flame again:

clinic flame –on-port=’autocannon -c100 localhost:$PORT/seed/v1′ — node index.js

This should produce a flame graph similar to the following:

Flame graph shows that Node.js event system stacks are still the bottleneck

Flame graph of the server when server.on is an empty function

This looks better, and we should have noticed an increase in request per second. But why is the event emitting code so hot? We would expect at this point for the HTTP processing code to take up the majority of CPU time, there’s nothing executing at all in the server.on event.

This type of bottleneck is caused by a function being executed more than it should be.

The following suspicious code at the top of util.js may be a clue:

require(‘events’).defaultMaxListeners = Infinity

Let’s remove this line and start our process with the –trace-warnings flag:

node –trace-warnings index.js

If we profile with AutoCannon in another terminal, like so:

autocannon -c100 localhost:3000/seed/v1

Our process will output something similar to:

(node:96371) MaxListenersExceededWarning: Possible EventEmitter memory leak detected. 11 after listeners added. Use emitter.setMaxListeners() to increase limit
at _addListener (events.js:280:19)
at Server.addListener (events.js:297:10)
at attachAfterEvent
(/Users/davidclements/z/nearForm/keeping-node-fast/slow/util.js:22:14)
at Server.
(/Users/davidclements/z/nearForm/keeping-node-fast/slow/util.js:25:7)
at call
(/Users/davidclements/z/nearForm/keeping-node-fast/slow/node_modules/restify/lib/chain.js:164:9)
at next
(/Users/davidclements/z/nearForm/keeping-node-fast/slow/node_modules/restify/lib/chain.js:120:9)
at Chain.run
(/Users/davidclements/z/nearForm/keeping-node-fast/slow/node_modules/restify/lib/chain.js:123:5)
at Server._runUse
(/Users/davidclements/z/nearForm/keeping-node-fast/slow/node_modules/restify/lib/server.js:976:19)
at Server._runRoute
(/Users/davidclements/z/nearForm/keeping-node-fast/slow/node_modules/restify/lib/server.js:918:10)
at Server._afterPre
(/Users/davidclements/z/nearForm/keeping-node-fast/slow/node_modules/restify/lib/server.js:888:10)

Node is telling us that lots of events are being attached to the server object. This is strange because there’s a boolean that checks if the event has been attached and then returns early essentially making attachAfterEvent a no-op after the first event is attached.

Let’s take a look at the attachAfterEvent function:

var afterEventAttached = false
function attachAfterEvent (server) {
if (attachAfterEvent === true) return
afterEventAttached = true
server.on(‘after’, (req, res) => {})
}

The conditional check is wrong! It checks whether attachAfterEvent is true instead of afterEventAttached. This means a new event is being attached to the server instance on every request, and then all prior attached events are being fired after each request. Whoops!

Optimizing

Now that we’ve discovered the problem areas, let’s see if we can make the server faster.

Low-Hanging Fruit

Let’s put the server.on listener code back (instead of an empty function) and use the correct boolean name in the conditional check. Our etagger function looks as follows:

function etagger () {
var cache = {}
var afterEventAttached = false
function attachAfterEvent (server) {
if (afterEventAttached === true) return
afterEventAttached = true
server.on(‘after’, (req, res) => {
if (res.statusCode !== 200) return
if (!res._body) return
const key = crypto.createHash(‘sha512’)
.update(req.url)
.digest()
.toString(‘hex’)
const etag = crypto.createHash(‘sha512’)
.update(JSON.stringify(res._body))
.digest()
.toString(‘hex’)
if (cache[key] !== etag) cache[key] = etag
})
}
return function (req, res, next) {
attachAfterEvent(this)
const key = crypto.createHash(‘sha512’)
.update(req.url)
.digest()
.toString(‘hex’)
if (key in cache) res.set(‘Etag’, cache[key])
res.set(‘Cache-Control’, ‘public, max-age=120’)
next()
}
}

Now we check our fix by profiling again. Start the server in one terminal:

node index.js

Then profile with AutoCannon:

autocannon -c100 localhost:3000/seed/v1

We should see results somewhere in the range of a 200 times improvement (Running 10s test @ http://localhost:3000/seed/v1 — 100 connections):

Stat
Avg
Stdev
Max

Latency (ms)
19.47
4.29
103

Req/Sec
5011.11
506.2
5487

Bytes/Sec
51.8 MB
5.45 MB
58.72 MB

50k requests in 10s, 519.64 MB read

It’s important to balance potential server cost reductions with development costs. We need to define, in our own situational contexts, how far we need to go in optimizing a project. Otherwise, it can be all too easy to put 80% of the effort into 20% of the speed enhancements. Do the constraints of the project justify this?

In some scenarios, it could be appropriate to achieve a 200 times improvement with a low hanging fruit and call it a day. In others, we may want to make our implementation as fast as it can possibly be. It really depends on project priorities.

One way to control resource spend is to set a goal. For instance, 10 times improvement, or 4000 requests per second. Basing this on business needs makes the most sense. For instance, if server costs are 100% over budget, we can set a goal of 2x improvement.

Is your pattern library up to date today? Alla Kholmatova has just finished a fully fledged book on Design Systems and how to get them right. With common traps, gotchas and the lessons she learned. Hardcover, eBook. Just sayin’.

Table of Contents →

Taking It Further

If we produce a new flame graph of our server, we should see something similar to the following:

Flame graph still shows server.on as the bottleneck, but a smaller bottleneck

Flame graph after the performance bug fix has been made

The event listener is still the bottleneck, it’s still taking up one-third of CPU time during profiling (the width is about one third the whole graph).

What additional gains can be made, and are the changes (along with their associated disruption) worth making?

With an optimized implementation, which is nonetheless slightly more constrained, the following performance characteristics can be achieved (Running 10s test @ http://localhost:3000/seed/v1 — 10 connections):

Stat
Avg
Stdev
Max

Latency (ms)
0.64
0.86
17

Req/Sec
8330.91
757.63
8991

Bytes/Sec
84.17 MB
7.64 MB
92.27 MB

92k requests in 11s, 937.22 MB read

While a 1.6x improvement is significant, it arguable depends on the situation whether the effort, changes, and code disruption necessary to create this improvement are justified. Especially when compared to the 200x improvement on the original implementation with a single bug fix.

To achieve this improvement, the same iterative technique of profile, generate flamegraph, analyze, debug, and optimize was used to arrive at the final optimized server, the code for which can be found here.

The final changes to reach 8000 req/s were:

Don’t build objects and then serialize, build a string of JSON directly;
Use something unique about the content to define it’s Etag, rather than creating a hash;
Don’t hash the URL, use it directly as the key.

These changes are slightly more involved, a little more disruptive to the code base, and leave the etagger middleware a little less flexible because it puts the burden on the route to provide the Etag value. But it achieves an extra 3000 requests per second on the profiling machine.

Let’s take a look at a flame graph for these final improvements:

Flame graph shows that internal code related to the net module is now the bottleneck

Healthy flame graph after all performance improvements

The hottest part of the flame graph is part of Node core, in the net module. This is ideal.

Preventing Performance Problems

To round off, here are some suggestions on ways to prevent performance issues in before they are deployed.

Using performance tools as informal checkpoints during development can filter out performance bugs before they make it into production. Making AutoCannon and Clinic (or equivalents) part of everyday development tooling is recommended.

When buying into a framework, find out what it’s policy on performance is. If the framework does not prioritize performance, then it’s important to check whether that aligns with infrastructural practices and business goals. For instance, Restify has clearly (since the release of version 7) invested in enhancing the library’s performance. However, if low cost and high speed is an absolute priority, consider Fastify which has been measured as 17% faster by a Restify contributor.

Watch out for other widely impacting library choices — especially consider logging. As developers fix issues, they may decide to add additional log output to help debug related problems in the future. If an unperformant logger is used, this can strangle performance over time after the fashion of the boiling frog fable. The pino logger is the fastest newline delimited JSON logger available for Node.js.

Finally, always remember that the Event Loop is a shared resource. A Node.js server is ultimately constrained by the slowest logic in the hottest path.

Smashing Editorial
(rb, ra, il)

Microsoft to Buy GitHub; Controversy Scheduled for This Week

Original Source: https://www.webdesignerdepot.com/2018/06/microsoft-to-buy-github-controversy-scheduled-for-this-week/

So yeah, what the title said. Microsoft is buying GitHub for 7.5 BILLION with a “B” US dollars. This is officially this week’s Big DealTM, and everyone’s going to be talking about it. It would not be quite accurate to say that GitHub powers software development as a whole, but it powers a lot of it. GitHub’s friendliness to — and free repositories for — open source software have made it nigh on indispensable for many developers around the world.

So now some people are freaking out. People unfamiliar with tech history or the open source world might wonder why. After all, companies change hands all the time. Sometimes that works out for consumers, and sometimes it doesn’t. I personally think it will work out, but I can understand why some people are angry.

GitHub’s friendliness to…open source software have made it nigh on indispensable for many developers

You see, once upon a time, Microsoft was the de facto bad guy of the tech world, and many people still see them that way. From the very beginning, MS embraced some pretty predatory business practices that put them in bad standing with users. Even after the famous antitrust case that broke their impending monopoly on web browsers (yeah, that almost happened), Microsoft has a record of buying good products and then killing them at a rate that rivals Electronic Arts.

What’s more, the Linux and open source community in particular got burned over the years, as Microsoft made a habit of using their advertising budget to spread unsubstantiated claims about Linux, other enterprise-focused operating systems, and open source data security options. People are still sore about that.

products Microsoft hasn’t killed have often ended up feeling rather lackluster

The products Microsoft hasn’t killed have often ended up feeling rather lackluster. Think of Skype, for example.

But I don’t think all is lost. No, Microsoft didn’t suddenly have a collective change of heart, and turn into do-gooders. I think they’ve just realized that ticking off everyone who isn’t them is a poor long-term business strategy. We live in a world where consumers increasingly demand that corporations at least pretend to be good guys, and so Microsoft seems to have changed their modus operandi, to some extent.

They bought LinkedIn for over 20 billion USD, and have let it run more or less as it did before. They released Visual Studio Code—one of the best code editors for Windows that we’ve had in a while—and it’s even open source.

Most telling, they killed Codeplex, their onetime competitor to GitHub, and started putting a lot of their own open source code on the latter platform. All of these actions directly contradict the old patterns Microsoft used to follow.

If they care at all about the goodwill they have earned themselves in the past few years, it would be best to let GitHub be GitHub. If they continue to follow this new pattern, they probably will. Indeed, in Microsoft’s own post on the subject, they state that they intend to let GitHub operate independently.

Acquisition will empower developers, accelerate GitHub’s growth and advance Microsoft services with new audiences

So do we believe them? Why buy GitHub at all, if they’re not going to monetize the hell out of it? Well they will, just not in the way everybody seems to fear. Microsoft doesn’t make most of their money from Windows by selling it to individual users. They do it by selling it to enterprise-level customers, and supporting it. The same goes for Microsoft Office Subscriptions. The indications seem to be pointing in the same direction for GitHub.

Microsoft will most likely develop and sell enterprise-specific tools and services around GitHub to entice their biggest customers onto the platform. They don’t want your money, they want that corporation money. I strongly suspect that for most individual developers and open source projects, the GitHub experience will remain unchanged.

So the average dev could probably look at this sale as a positive change, or at least a neutral one. Failing that, there’s always Gitlab or Bitbucket.

Add Realistic Chalk and Sketch Lettering Effects with Sketch’it – only $5!

Source

p img {display:inline-block; margin-right:10px;}
.alignleft {float:left;}
p.showcase {clear:both;}
body#browserfriendly p, body#podcast p, div#emailbody p{margin:0;}

How To Create An Innovative Web Design Agency Website in 5 Steps

Original Source: http://feedproxy.google.com/~r/Designrfix/~3/G7CLXu9AnnI/how-to-create-an-innovative-web-design-agency-website-in-5-steps

If you want your business to be prosperous and popular among customers, it’s indispensable to create a website for it. The worldwide web is the first place to which people refer in search of new knowledge, inspiration, and resources that will get specific types of services done in the pro way. Are you a freelance […]

The post How To Create An Innovative Web Design Agency Website in 5 Steps appeared first on designrfix.com.