Performance Auditing: A Firefox Developer Tools Deep Dive
Original Source: https://www.sitepoint.com/performance-auditing-a-firefox-developer-tools-deep-dive/
In this article, we’ll cover Firefox Web Developer Tools (“DevTools”) — a set of tools designed to help developers inspect, debug, profile and optimize the performance of websites and web applications. We’ll particularly look at the tools related to performance, but we’ll also see how to get started using DevTools in general, and learn about some useful settings.
You can access DevTools in different ways:
click on the hamburger menu at the right of the navigation toolbar, click on Web Developer, then choose the sub-tool you want to use
use keyboard combinations, such as Shift+F5 (Windows and macOS) for the Performance tool and Ctrl+Shift+E (Windows) or Cmd+Option+E (macOS) for the Network tool
right-click anywhere in the page a choose Inspect Element.
DevTools Settings
The Firefox DevTools have many options that help developers customize their experience, such as the option to Enable time-stamps in the Web Console, or to Disable HTTP Cache, which is used to simulate first-load performance in all pages that have DevTools open.
You can access the DevTools Settings panel in different ways:
Start by opening DevTools, next:
either click the Settings button in the toolbar
press F1 to show the Settings panel on top of any current tool
press Ctrl+Shift+O (Windows and Linux), Cmd+Shift+O (macOS) to show the Settings panel.
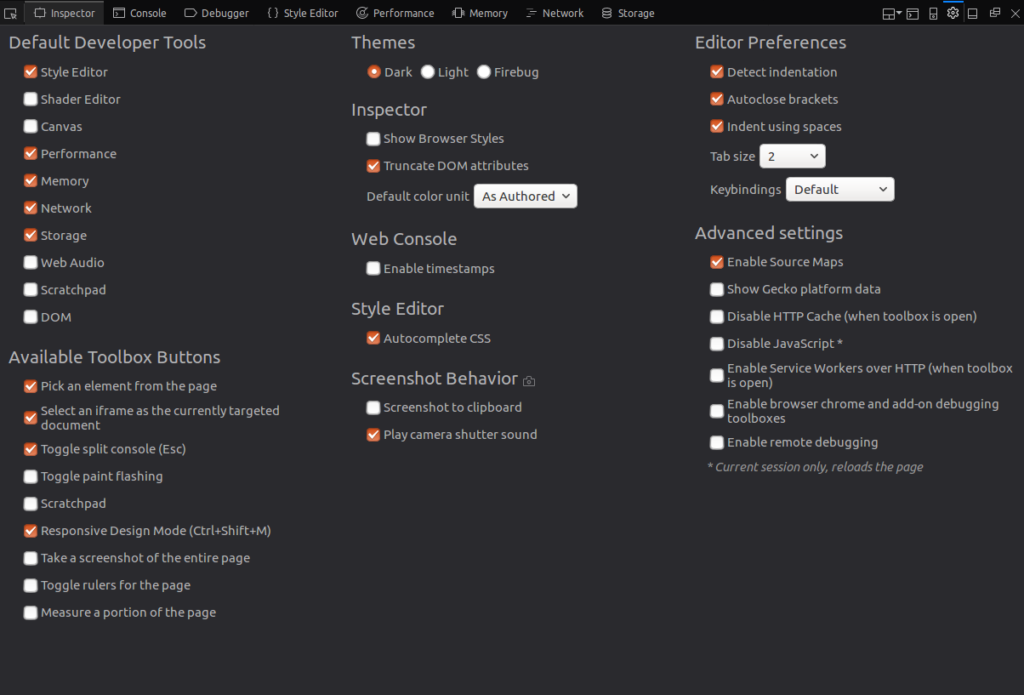
Here you can choose your default tools, the buttons you want to show in the toolbox, themes (dark-light-Firebug) and other advanced settings.
Performance-focused Tools
When analyzing the performance of a web application, you need to differentiate between load-time performance and run-time performance.
Load-time performance answers questions like “what resources are taking too much time to load?” When dealing with run-time performance, we need to focus on JavaScript and CSS (CSS animations in particular) so we’re able to see where the code spends most of its time and what’s causing bottlenecks.
Let’s look at the Network Monitor and the Performance Tool.
The Network Monitor
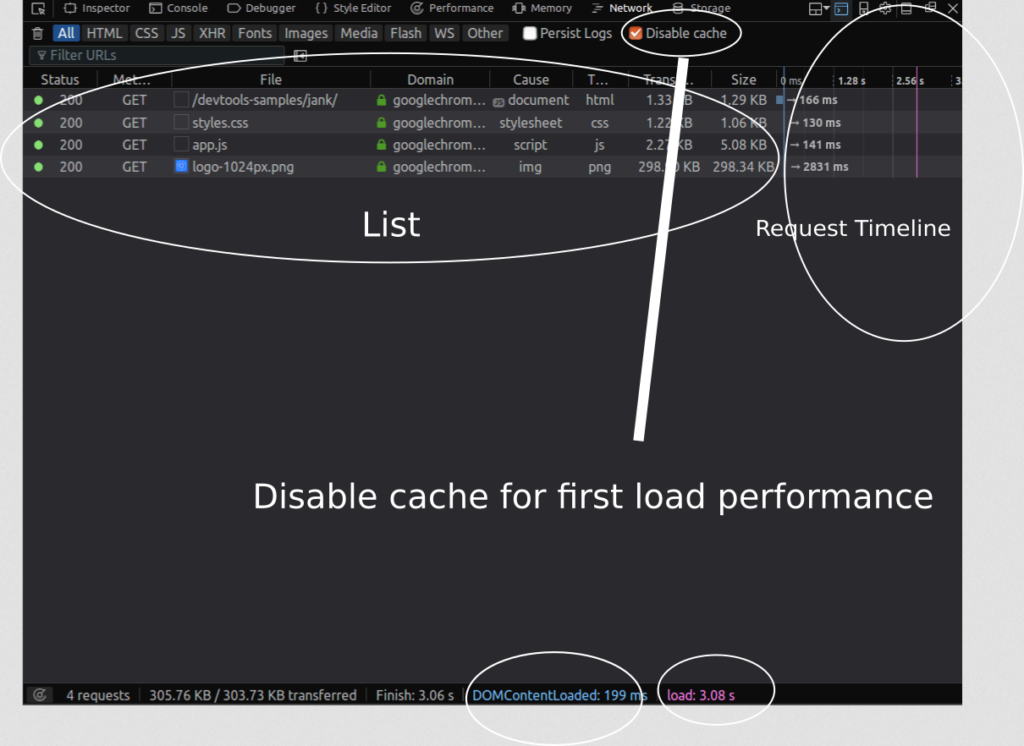
The Network Monitor shows you a tabular view of all network requests that Firefox made (for example, when it’s loading a page, or sending XMLHttpRequests, Fetch API requests etc.).
It can also display request-related HTTP headers, HTTP responses and cookies, and let you search through them. You can also use it to perform, display and save a performance analysis of the current page load.
In a nutshell, this tool can be used to determine how long the browser takes to download different assets of a web page.
You can also use this tool to monitor and single out requests that are slowing or blocking the web page’s fast loading. The Network panel shows you when principal events are fired (DOMContentLoaded and load).
Request Timeline
Each request in the network list has a timeline column which displays timing information related to the request, such as the total time taken to load the resource.
DevTools marks major life-cycle events in the report, like DOMContentLoaded, and page load. The blue refers to the time when the event DOMContentLoaded is fired; the purple line refers to the time when the page’s load event is fired.
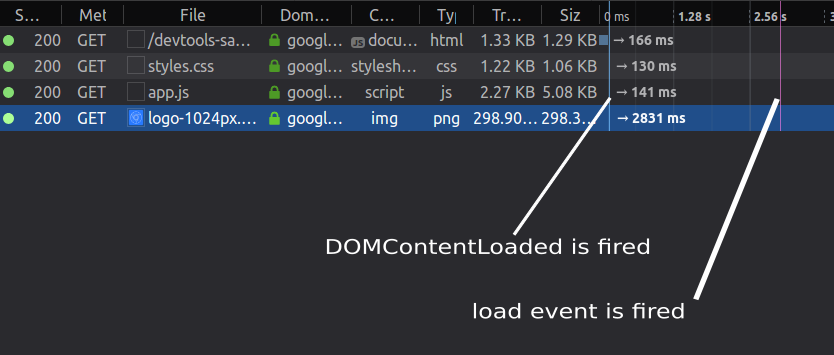
DOMContentLoaded vs Load Events
The DOMContentLoaded event fires right when the HTML document is completely loaded and parsed, not including CSS style sheets, images, and frames.
The event load fires when the HTML document and all associated style sheets, images and frames are completely loaded.
Request Details Panel
Once you click on a request in the requests list, you can a see right-docked details pane which has many different tabs such as headers, params, response, timings and security.
For performance, we’ll particularly look at the timing information.
Network Timings
In this pane, there are many timing metrics related to each request:
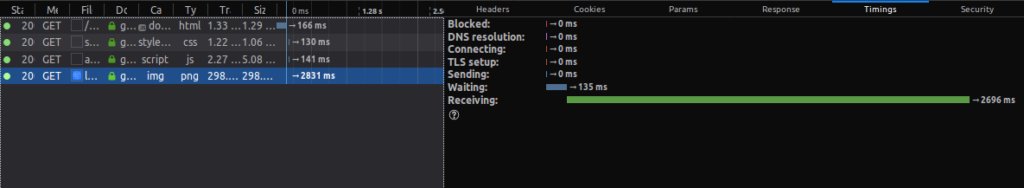
Blocked is the time spent in a queue waiting for a network connection.
Sending is the time taken for sending the request to the server.
Receiving is the time taken to receive the response from the server or (if it’s cached) to read it from the cache.
Waiting is the total time waited by the client before the first byte has been received. In other performance analysis tools like WebPageTest.org or Chrome’s DevTools, this is called TTFB or Time to First Byte.
There’s also DNS resolution, which is the time taken to resolve the host name of the server, and Connecting, which is the time taken to open a TCP connection.
How to analyze the load time performance
The Network Monitor integrates a performance analysis tool that can be used to analyze the load-time performance of your web page.
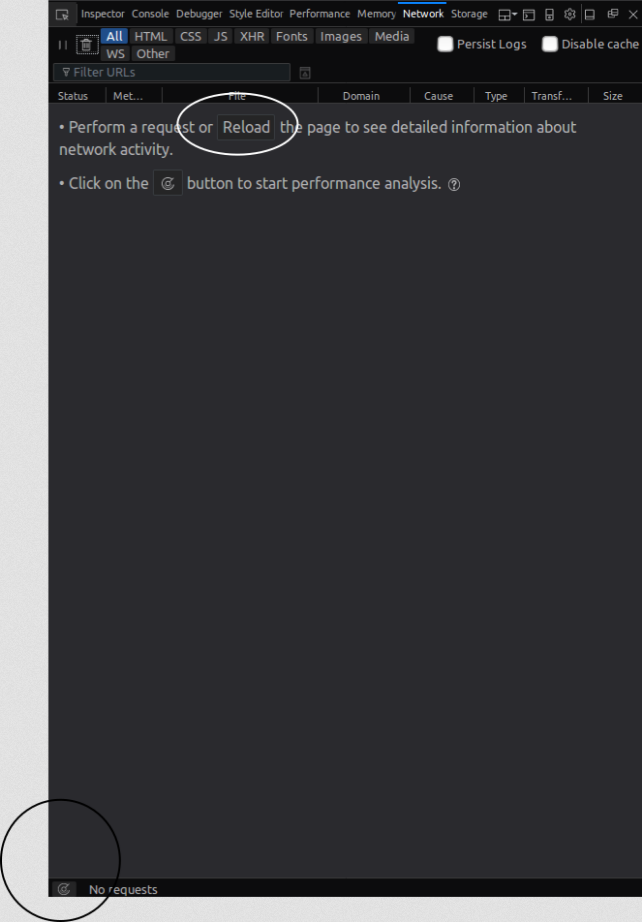
To start analyzing the load-time performance, you can:
click the Analyze icon in the bottom status bar
reload your page or make a network request while your Network monitor is open (actually this is going only to show tabular information about requests not do a load-time performance analysis).
The final report shows a pie chart and a corresponding table for the received resources by types: JavaScript, CSS, images and fonts etc. and a summary with the following details:
number of cached responses
total requests
size
transferred size
loading time
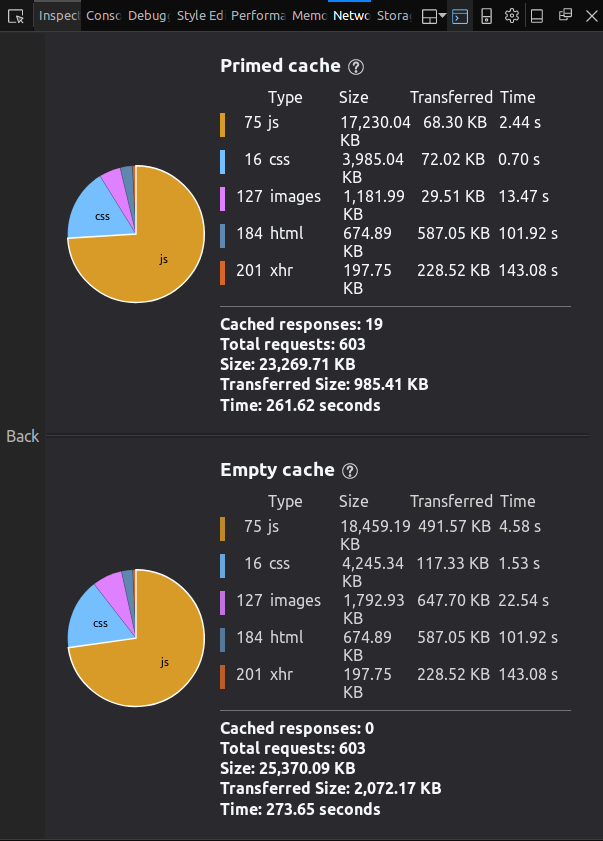
The web page is tested with an empty cache, and with a primed cache.
First load performance
Firefox’s DevTools allow you to analyze the performance of your web application in two different situations:
Without caching, which emulates the first-time visit when assets are still not cached.
With caching, which emulates the second-time visits. The browser has already cached the app’s assets, eliminating many round-trips to the server.
You can also use the Disable Cache setting to emulate the first-time load of a web page when the DevTools are open on any tab.
The post Performance Auditing: A Firefox Developer Tools Deep Dive appeared first on SitePoint.


Leave a Reply
Want to join the discussion?Feel free to contribute!