10 Unique & High Quality Free Photoshop Brush Packs

Original Source: http://feedproxy.google.com/~r/1stwebdesigner/~3/N3c0dx4cWFc/

Whether you’re a photographer, artist or designer, Photoshop brushes can be a huge help. Simulate watercolors, clouds, smoke, grain, explosions – the extent of what they can do is limitless. People seem to collect and hoard Photoshop brushes like they’re going out of style.

The huge demand has led to an abundance of free resources across the web. Even if you can’t afford huge, premium packs, you can still find quality brushes for use in your work. Here are ten invaluable and beautiful brush sets – available for anyone to download.

Your Designer Toolbox
Unlimited Downloads: 500,000+ Web Templates, Icon Sets, Themes & Design Assets


DOWNLOAD NOW

Ultimate Brush Pack 5

Ultimate Brush Pack 5

Who could say no to 87 high-resolution brushes? These explosive patterns can add a paint-like, textured feel to your images. Great for clouds, abstract pieces and anything that requires a dynamic texture.

83 Light and Burst Brushes

83 Light and Burst Brushes

Lens flares, sunbeams and bursts of light; these brushes can give any image a sunny, bright effect. It also works great for general lighting, magical effects and even as background textures. Along with rays and waves of light, there are also halos and coronas to give the sun a more striking ring.

Bling Effects Pack

Bling Effects Pack

Sometimes a picture needs some extra bling. Maybe some sparkles, a lens flare, or a perfectly-placed light flash will do the trick. The Bling Effects Pack can help you add some pizzazz to a boring picture. Just remember that effects like this should be used sparingly as enhancements.

Watercolor 93

Watercolor 93

This pack of nearly a hundred brushes was created from actual dabs of watercolor that were scanned. There are varying shapes, intensities and luminosities to each brush – so there’s a ton of variety. If you’re creating something that requires a softer look, these watercolors will do the trick.

Hair Brush Set

Hair Brush Set

Whether you’re painting hair or just need a wispy, soft texture, the Hair Brush Set can get the job done. You’ll need a pressure sensitive tablet to get the full detailing effect. Perfect for creating fine, feathery textures.

lazy brush set

lazy brush set

Need a huge pack of essentials? The lazy brush set contains 174 brushes, varying from basics to textures to silhouettes and light flares. It’s great for artists, but many of these brushes can be used in design work too. If you can only download one brush set, choose this one; it’s huge and contains just about everything you’ll need.

Free Brush Stroke Photoshop Brushes

Free Brush Stroke Photoshop Brushes

These 15 high-resolution brush strokes look great in almost any project. Modelled after watercolors, they have a multitude of uses, from professional effects to sketches to grungy art pieces. Basic, but essential.

Free Hi-Res Photoshop Brushes: Acrylic Textures

Free Hi-Res Photoshop Brushes: Acrylic Textures

If you need a rough, realistic, watercolor-like look, these acrylic textures will be perfect. At 2500px, every stroke will be detailed and gorgeous. If your designs turn out looking false or cartoony, these brushes can help them to appear more organic.

Radiate Brush Set

Radiate Brush Set

Looking for something a little more abstract? Great for posters, backgrounds and tech projects, Radiate was created by modifying different shapes. The fringe style is just what you need if you’re trying to make your piece look extra cool.

Mad Fractal

Mad Fractal

Fractal brushes are great for backgrounds, wispy textures and abstract designs. Their randomness makes an image more interesting. And there’s 30 brushes, so your design options with this collection are limitless.

Beautiful Brushes

Finding the best brushes can take some experimenting, so feel free to download lots of them to test out! The sites listed here have plenty of free brush packs to try. Do some digging and testing until you have some that you feel comfortable using. Once you find one (or ten) that work for you, you’ll be effortlessly crafting beautiful art, photos and web design layouts.


Brand Identity for Really. by Tata&Friends Studio

Original Source: http://feedproxy.google.com/~r/abduzeedo/~3/i9qU546aZbM/brand-identity-really-tatafriends-studio

Brand Identity for Really. by Tata&Friends Studio

Brand Identity for Really. by Tata&Friends Studio

abduzeedo
Jun 04, 2018

Tata&Friends Studio shared a beautiful brand identity project on their Behance profile. It’s for Everis’ content agency. There are many things to talk about the design solution but for me, the most important is the simplicity. I love seeing projects that rely on simple typography with handpicked visual ornaments to focus on the basics. It’s all the contrast of types and wise usage of white space.

Really is the content agency of everis. As content creators their work range from illustrations, infographics – to video production, a wide range of different creative projects. Really craft contents and visual solutions for brands. Our approach was to define the naming and visual universe of the brand. 

Brand identity

Naming: 

The name Really. is a statement, represents a solution, a final product, something to be proud of. 

Visual: 

We use holographic stamping to create “the metaphor of everything” in order to represent the creative result.


Tata&Friends Studio is ta design muscle for positive brands. They believe in process, research, experiments, curiosity and positive thinking. It is a collaborative studio, a place to grow, to collaborate, to learn and to share knowledge.


Brand Identity for New York City Architecture Firm Dash Marshall

Original Source: http://feedproxy.google.com/~r/abduzeedo/~3/Cll8SUM5pwk/brand-identity-new-york-city-architecture-firm-dash-marshall

Brand Identity for New York City Architecture Firm Dash Marshall

Brand Identity for New York City Architecture Firm Dash Marshall

abduzeedo
Jun 05, 2018

TwoPoints.Net shared a beautiful brand identity project for the New York City architecture firm Dash Marshall. When designing the corporate identity they realized that architecture acts in the intersection of the old and the new, the static and the flexible, the properties of matter and the lives of people. Within these constraints, Dash Marshall creates spaces which tell the stories of their habitants and invites them to create new ones.

“Just as Michel de Certeau argued that spatial stories are what actuate the notion of place, our physical environments can give rise to new characters and events by organizing, proffering and collectivizing human sensibilities. They may even allow certain transgressions to occur, as the Independent Group aspired to do. For this reason, an architecture that upholds its commitment to its users holds tremendous power: its narratives of the past and present are the framework from which to imagine the future scripts of tomorrow.” writes Esther Choi (estherchoi.net) in the preface of the book “Matter Battle, 45 Lessons Learned” by Dash Marshal

The obvious eventually came to us as a surprise. Today’s corporate communication has become almost exclusively digital. It is context-responsive, morphological and semiological, and almost unaware of physical constraints. To design a consistent visual language for an architecture office, acting in the material, but communicating in the immaterial world, was the challenge. Our solution is a flexible visual identity which works within a confined space of the letters “D” and “M”. Like outer walls of an apartment or the plot of a house, the letters “DM” create a confined space, but within this framework nearly anything is possible.

To tell the stories of Dash Marshall we have not just designed their Visual Identity, but also their website, the book “Matter Battles: 45 Lessons Learned” and the booklet “Small Measures”.

Client: Dash Marshall
Year: 2015—2018

The letters “DM”, drawn in the isometric perspective, are the archetype of the visual identity. The lines of the letters may be removed and colored, creating a multitude of variations of the icon.

Brand Identity

Dash Marshall’s architecture plays with contradictions as old and new, classic and modern, emotional and rational. To visualize these contrasts we added the drawn Berlingske to the constructed graphic system.

“Matter Battle, 45 Lessons Learned” by Dash Marshall.

Producing a beautiful book has to be considered today a statement in itself. The time, work and money going into a physical object, which will be given away to only 200 select individuals, shows the appreciation of the constraints of the physical world.

Along with the big book, comes a smaller, shorter book called “Small Measures”, focusing on the details of the projects and presenting them only in cropped images. The combination of a large and small book give Dash Marshall the flexibility to convey their work in different ways based on the needs of a given situation. A small book for small meetings, A big book for more substantial introductions, or both for moments of special gratitude.


branding


The Trouble with Cheap eCommerce

Original Source: http://feedproxy.google.com/~r/1stwebdesigner/~3/S6YL4ZuvVoQ/

It used to be that building an eCommerce website was an arduous and expensive task. And while that is still the case in some specialized situations, those barriers have been largely removed when it comes to more mainstream usage.

Take WooCommerce, for example. It’s a free eCommerce plugin for WordPress; the most widely used content management system on Earth. Right out of the box, it enables anyone to sell their products and accept payments online. If you need more specialized functionality, it’s widely available in the form of free or reasonably-priced premium extensions.

This is certainly a great development for small businesses that don’t necessarily have a huge budget for building a website. But, what type of impact does it have on eCommerce overall? And what, if any, negative side effects have “cheap” eCommerce platforms had on web designers?

Square Holes and Round Pegs

It seems that, no matter how many online stores you build, no two will be exactly the same. Products, services and even business owners are all variables that need to be taken into consideration – and that’s even before you start the design and development process.

On the surface, it may look as though a tool like WooCommerce is perfect to handle all the different quirks that go along with customizing an eCommerce site. After all, you get to pick and choose which extensions you need. Plus, skilled developers can even create their own solutions.

Yet, it often feels like we’re trying to bend and shape extensions or the basic cart itself to fit into our own narrow use cases. The results are mixed, with some features essentially going against the grain of what the original software was intended to do.

Yes, we have options, but what if those options don’t really align with our needs? And this isn’t just limited to WooCommerce. Other, more proprietary eCommerce suites aren’t necessarily more flexible – some are even less so.

The problem here is that a one-size-fits-all approach means that site owners won’t necessarily get everything they want. That shouldn’t even be a problem, as low-cost solutions aren’t meant to attend to each and every need. But that brings us to the next point.

Square Holes and Round Pegs

The Expectation of Low (Or No) Cost

Because the barrier to entry is so low, many seem to think that eCommerce can and should be done on the cheap. The expectation is that, no matter the need, a top-quality shop can be built for very little cost.

Sometimes, that expectation actually comes to fruition. Depending on a client’s specific needs, it is possible to build something that looks great and performs the necessary functions on a tight budget. However, it doesn’t mean that every case is going to turn out that well.

The more realistic view is that each and every feature that goes into a website has an associated cost. This is especially true for eCommerce, where a seemingly “little” tweak can take up a lot of time and resources to implement.

But because there are so many free and low-cost tools out there, some clients simply expect that everything can be taken care of with minimal effort and at extremely little cost. Personally, I’ve seen cases where site owners refused to even purchase a fairly cheap but specific bit of functionality that was critical to making sure orders came through correctly.

It may be a risk they were willing to take, but the approach was very short-sighted.

The Expectation of Low (Or No) Cost

Above All, eCommerce is an Investment

As the professional designers and developers in the room, it’s up to us to communicate exactly what goes into making an eCommerce site work. That doesn’t need to include every single technical detail. But it should include an honest assessment of how complex the entire process is and that one-size-fits-all often means making some sacrifices.

Even more important is that clients should understand that an investment in their eCommerce site is an investment in their own success. It’s understandable that some far-flung features could be put on hold until there are more resources available. However, there are some types of functionality that are simply too vital to skimp on.

Once, I worked with a client who utilized a SaaS shopping cart provider that increased their monthly subscription fees. As any of us might, the client lamented the fact that costs were going up. But when you looked at the bigger picture, the price hike was miniscule when compared to the amount of money being made off of the website itself. It was a relatively small price to pay for success.

If that same client were to sell through more traditional brick-and-mortar channels, their overhead costs would have been significantly more. Yet, because they were used to paying very little for eCommerce capabilities, the expectations were completely different.

This is a point worth making to clients who scoff at paying a bit extra for a worthy investment. Relatively speaking, the potential rewards for doing things the right way can easily outweigh the initial cost.

eCommerce is an Investment

Keeping It Real

While free and low-cost eCommerce isn’t the right way to go for everyone, it can still be quite effective for many businesses. The key is in understanding what it can and can’t do, along with keeping realistic expectations.

The bottom line is that you’re not going to create a site that works exactly like Amazon on a shoestring budget. Clients often see what the “big” players are doing and naturally want to mimic their success. While we can certainly understand their hopes, we also need to communicate what can be done for what they’re able to spend.

Overall, it’s great to see that anyone can enter the eCommerce game. Our goal as designers should be to help clients learn about the positives, negatives and realities of selling online.


How to Zoom This Close Into Google Maps

Original Source: https://www.hongkiat.com/blog/how-to-zoom-this-close-into-google-maps/

It is almost impossible to imagine doing day-trips or traveling to a new place without checking it out on Google Maps. Unfortunately, it restricts to zoom in after a certain level. However, there is…

Visit hongkiat.com for full content.

How To Create An Innovative Web Design Agency Website in 5 Steps

Original Source: http://feedproxy.google.com/~r/Designrfix/~3/G7CLXu9AnnI/how-to-create-an-innovative-web-design-agency-website-in-5-steps

If you want your business to be prosperous and popular among customers, it’s indispensable to create a website for it. The worldwide web is the first place to which people refer in search of new knowledge, inspiration, and resources that will get specific types of services done in the pro way. Are you a freelance […]

The post How To Create An Innovative Web Design Agency Website in 5 Steps appeared first on designrfix.com.

Microsoft to Buy GitHub; Controversy Scheduled for This Week

Original Source: https://www.webdesignerdepot.com/2018/06/microsoft-to-buy-github-controversy-scheduled-for-this-week/

So yeah, what the title said. Microsoft is buying GitHub for 7.5 BILLION with a “B” US dollars. This is officially this week’s Big DealTM, and everyone’s going to be talking about it. It would not be quite accurate to say that GitHub powers software development as a whole, but it powers a lot of it. GitHub’s friendliness to — and free repositories for — open source software have made it nigh on indispensable for many developers around the world.

So now some people are freaking out. People unfamiliar with tech history or the open source world might wonder why. After all, companies change hands all the time. Sometimes that works out for consumers, and sometimes it doesn’t. I personally think it will work out, but I can understand why some people are angry.

GitHub’s friendliness to…open source software have made it nigh on indispensable for many developers

You see, once upon a time, Microsoft was the de facto bad guy of the tech world, and many people still see them that way. From the very beginning, MS embraced some pretty predatory business practices that put them in bad standing with users. Even after the famous antitrust case that broke their impending monopoly on web browsers (yeah, that almost happened), Microsoft has a record of buying good products and then killing them at a rate that rivals Electronic Arts.

What’s more, the Linux and open source community in particular got burned over the years, as Microsoft made a habit of using their advertising budget to spread unsubstantiated claims about Linux, other enterprise-focused operating systems, and open source data security options. People are still sore about that.

products Microsoft hasn’t killed have often ended up feeling rather lackluster

The products Microsoft hasn’t killed have often ended up feeling rather lackluster. Think of Skype, for example.

But I don’t think all is lost. No, Microsoft didn’t suddenly have a collective change of heart, and turn into do-gooders. I think they’ve just realized that ticking off everyone who isn’t them is a poor long-term business strategy. We live in a world where consumers increasingly demand that corporations at least pretend to be good guys, and so Microsoft seems to have changed their modus operandi, to some extent.

They bought LinkedIn for over 20 billion USD, and have let it run more or less as it did before. They released Visual Studio Code—one of the best code editors for Windows that we’ve had in a while—and it’s even open source.

Most telling, they killed Codeplex, their onetime competitor to GitHub, and started putting a lot of their own open source code on the latter platform. All of these actions directly contradict the old patterns Microsoft used to follow.

If they care at all about the goodwill they have earned themselves in the past few years, it would be best to let GitHub be GitHub. If they continue to follow this new pattern, they probably will. Indeed, in Microsoft’s own post on the subject, they state that they intend to let GitHub operate independently.

Acquisition will empower developers, accelerate GitHub’s growth and advance Microsoft services with new audiences

So do we believe them? Why buy GitHub at all, if they’re not going to monetize the hell out of it? Well they will, just not in the way everybody seems to fear. Microsoft doesn’t make most of their money from Windows by selling it to individual users. They do it by selling it to enterprise-level customers, and supporting it. The same goes for Microsoft Office Subscriptions. The indications seem to be pointing in the same direction for GitHub.

Microsoft will most likely develop and sell enterprise-specific tools and services around GitHub to entice their biggest customers onto the platform. They don’t want your money, they want that corporation money. I strongly suspect that for most individual developers and open source projects, the GitHub experience will remain unchanged.

So the average dev could probably look at this sale as a positive change, or at least a neutral one. Failing that, there’s always Gitlab or Bitbucket.

Add Realistic Chalk and Sketch Lettering Effects with Sketch’it – only $5!

Source

p img {display:inline-block; margin-right:10px;}
.alignleft {float:left;}
p.showcase {clear:both;}
body#browserfriendly p, body#podcast p, div#emailbody p{margin:0;}

Keeping Node.js Fast: Tools, Techniques, And Tips For Making High-Performance Node.js Servers

Original Source: https://www.smashingmagazine.com/2018/06/nodejs-tools-techniques-performance-servers/

Keeping Node.js Fast: Tools, Techniques, And Tips For Making High-Performance Node.js Servers

Keeping Node.js Fast: Tools, Techniques, And Tips For Making High-Performance Node.js Servers

David Mark Clements

2018-06-07T13:45:51+02:00
2018-06-07T12:12:00+00:00

If you’ve been building anything with Node.js for long enough, then you’ve no doubt experienced the pain of unexpected speed issues. JavaScript is an evented, asynchronous language. That can make reasoning about performance tricky, as will become apparent. The surging popularity of Node.js has exposed the need for tooling, techniques and thinking suited to the constraints of server-side JavaScript.

When it comes to performance, what works in the browser doesn’t necessarily suit Node.js. So, how do we make sure a Node.js implementation is fast and fit for purpose? Let’s walk through a hands-on example.

Tools

Node is a very versatile platform, but one of the predominant applications is creating networked processes. We’re going to focus on profiling the most common of these: HTTP web servers.

We’ll need a tool that can blast a server with lots of requests while measuring the performance. For example, we can use AutoCannon:

npm install -g autocannon

Other good HTTP benchmarking tools include Apache Bench (ab) and wrk2, but AutoCannon is written in Node, provides similar (or sometimes greater) load pressure, and is very easy to install on Windows, Linux, and Mac OS X.

Nope, we can’t do any magic tricks, but we have articles, books and webinars featuring techniques we all can use to improve our work. Smashing Members get a seasoned selection of magic front-end tricks — e.g. live designing sessions and perf audits, too. Just sayin’! 😉

Explore Smashing Wizardry →

Smashing Cat, just preparing to do some magic stuff.

After we’ve established a baseline performance measurement, if we decide our process could be faster we’ll need some way to diagnose problems with the process. A great tool for diagnosing various performance issues is Node Clinic, which can also be installed with npm:

npm –install -g clinic

This actually installs a suite of tools. We’ll be using Clinic Doctor and Clinic Flame (a wrapper around 0x) as we go.

Note: For this hands-on example we’ll need Node 8.11.2 or higher.

The Code

Our example case is a simple REST server with a single resource: a large JSON payload exposed as a GET route at /seed/v1. The server is an app folder which consists of a package.json file (depending on restify 7.1.0), an index.js file and a util.js file.

The index.js file for our server looks like so:

‘use strict’

const restify = require(‘restify’)
const { etagger, timestamp, fetchContent } = require(‘./util’)()
const server = restify.createServer()

server.use(etagger().bind(server))

server.get(‘/seed/v1’, function (req, res, next) {
fetchContent(req.url, (err, content) => {
if (err) return next(err)
res.send({data: content, url: req.url, ts: timestamp()})
next()
})
})

server.listen(3000)

This server is representative of the common case of serving client-cached dynamic content. This is achieved with the etagger middleware, which calculates an ETag header for the latest state of the content.

The util.js file provides implementation pieces that would commonly be used in such a scenario, a function to fetch the relevant content from a backend, the etag middleware and a timestamp function that supplies timestamps on a minute-by-minute basis:

‘use strict’

require(‘events’).defaultMaxListeners = Infinity
const crypto = require(‘crypto’)

module.exports = () => {
const content = crypto.rng(5000).toString(‘hex’)
const ONE_MINUTE = 60000
var last = Date.now()

function timestamp () {
var now = Date.now()
if (now — last >= ONE_MINUTE) last = now
return last
}

function etagger () {
var cache = {}
var afterEventAttached = false
function attachAfterEvent (server) {
if (attachAfterEvent === true) return
afterEventAttached = true
server.on(‘after’, (req, res) => {
if (res.statusCode !== 200) return
if (!res._body) return
const key = crypto.createHash(‘sha512’)
.update(req.url)
.digest()
.toString(‘hex’)
const etag = crypto.createHash(‘sha512’)
.update(JSON.stringify(res._body))
.digest()
.toString(‘hex’)
if (cache[key] !== etag) cache[key] = etag
})
}
return function (req, res, next) {
attachAfterEvent(this)
const key = crypto.createHash(‘sha512’)
.update(req.url)
.digest()
.toString(‘hex’)
if (key in cache) res.set(‘Etag’, cache[key])
res.set(‘Cache-Control’, ‘public, max-age=120’)
next()
}
}

function fetchContent (url, cb) {
setImmediate(() => {
if (url !== ‘/seed/v1’) cb(Object.assign(Error(‘Not Found’), {statusCode: 404}))
else cb(null, content)
})
}

return { timestamp, etagger, fetchContent }

}

By no means take this code as an example of best practices! There are multiple code smells in this file, but we’ll locate them as we measure and profile the application.

To get the full source for our starting point, the slow server can be found over here.

Profiling

In order to profile, we need two terminals, one for starting the application, and the other for load testing it.

In one terminal, within the app, folder we can run:

node index.js

In another terminal we can profile it like so:

autocannon -c100 localhost:3000/seed/v1

This will open 100 concurrent connections and bombard the server with requests for ten seconds.

The results should be something similar to the following (Running 10s test @ http://localhost:3000/seed/v1 — 100 connections):

Stat
Avg
Stdev
Max

Latency (ms)
3086.81
1725.2
5554

Req/Sec
23.1
19.18
65

Bytes/Sec
237.98 kB
197.7 kB
688.13 kB

231 requests in 10s, 2.4 MB read

Results will vary depending on the machine. However, considering that a “Hello World” Node.js server is easily capable of thirty thousand requests per second on that machine that produced these results, 23 requests per second with an average latency exceeding 3 seconds is dismal.

Diagnosing

Discovering The Problem Area

We can diagnose the application with a single command, thanks to Clinic Doctor’s –on-port command. Within the app folder we run:

clinic doctor –on-port=’autocannon -c100 localhost:$PORT/seed/v1’ — node index.js

This will create an HTML file that will automatically open in our browser when profiling is complete.

The results should look something like the following:

Clinic Doctor has detected an Event Loop issue

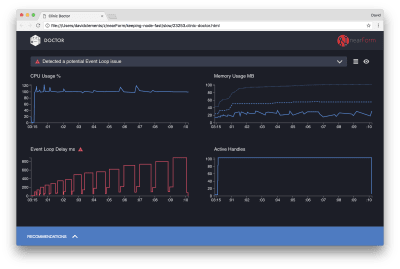
Clinic Doctor results

The Doctor is telling us that we have probably had an Event Loop issue.

Along with the message near the top of the UI, we can also see that the Event Loop chart is red, and shows a constantly increasing delay. Before we dig deeper into what this means, let’s first understand the effect the diagnosed issue is having on the other metrics.

We can see the CPU is consistently at or above 100% as the process works hard to process queued requests. Node’s JavaScript engine (V8) actually uses two CPU cores. One for the Event Loop and the other for Garbage Collection. When we see the CPU spiking up to 120% in some cases, the process is collecting objects related to handled requests.

We see this correlated in the Memory graph. The solid line in the Memory chart is the Heap Used metric. Any time there’s a spike in CPU we see a fall in the Heap Used line, showing that memory is being deallocated.

Active Handles are unaffected by the Event Loop delay. An active handle is an object that represents either I/O (such as a socket or file handle) or a timer (such as a setInterval). We instructed AutoCannon to open 100 connections (-c100). Active handles stay a consistent count of 103. The other three are handles for STDOUT, STDERR, and the handle for the server itself.

If we click the Recommendations panel at the bottom of the screen, we should see something like the following:

Clinic Doctor recommendations panel opened

Viewing issue specific recommendations

Short-Term Mitigation

Root cause analysis of serious performance issues can take time. In the case of a live deployed project, it’s worth adding overload protection to servers or services. The idea of overload protection is to monitor event loop delay (among other things), and respond with “503 Service Unavailable” if a threshold is passed. This allows a load balancer to fail over to other instances, or in the worst case means users will have to refresh. The overload-protection module can provide this with minimum overhead for Express, Koa, and Restify. The Hapi framework has a load configuration setting which provides the same protection.

Understanding The Problem Area

As the short explanation in Clinic Doctor explains, if the Event Loop is delayed to the level that we’re observing it’s very likely that one or more functions are “blocking” the Event Loop.

It’s especially important with Node.js to recognize this primary JavaScript characteristic: asynchronous events cannot occur until currently executing code has completed.

This is why a setTimeout cannot be precise.

For instance, try running the following in a browser’s DevTools or the Node REPL:

console.time(‘timeout’)
setTimeout(console.timeEnd, 100, ‘timeout’)
let n = 1e7
while (n–) Math.random()

The resulting time measurement will never be 100ms. It will likely be in the range of 150ms to 250ms. The setTimeout scheduled an asynchronous operation (console.timeEnd), but the currently executing code has not yet complete; there are two more lines. The currently executing code is known as the current “tick.” For the tick to complete, Math.random has to be called ten million times. If this takes 100ms, then the total time before the timeout resolves will be 200ms (plus however long it takes the setTimeout function to actually queue the timeout beforehand, usually a couple of milliseconds).

In a server-side context, if an operation in the current tick is taking a long time to complete requests cannot be handled, and data fetching cannot occur because asynchronous code will not be executed until the current tick has completed. This means that computationally expensive code will slow down all interactions with the server. So it’s recommended to split out resource intense work into separate processes and call them from the main server, this will avoid cases where on rarely used but expensive route slows down the performance of other frequently used but inexpensive routes.

The example server has some code that is blocking the Event Loop, so the next step is to locate that code.

Analyzing

One way to quickly identify poorly performing code is to create and analyze a flame graph. A flame graph represents function calls as blocks sitting on top of each other — not over time but in aggregate. The reason it’s called a ‘flame graph’ is because it typically uses an orange to red color scheme, where the redder a block is the “hotter” a function is, meaning, the more it’s likely to be blocking the event loop. Capturing data for a flame graph is conducted through sampling the CPU — meaning that a snapshot of the function that is currently being executed and it’s stack is taken. The heat is determined by the percentage of time during profiling that a given function is at the top of the stack (e.g. the function currently being executed) for each sample. If it’s not the last function to ever be called within that stack, then it’s likely to be blocking the event loop.

Let’s use clinic flame to generate a flame graph of the example application:

clinic flame –on-port=’autocannon -c100 localhost:$PORT/seed/v1’ — node index.js

The result should open in our browser with something like the following:

Clinic’s flame graph shows that server.on is the bottleneck

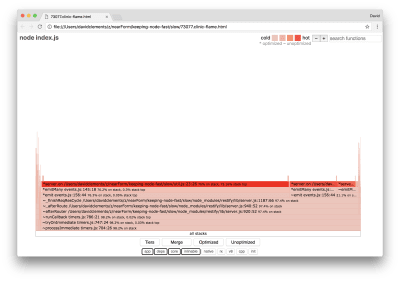
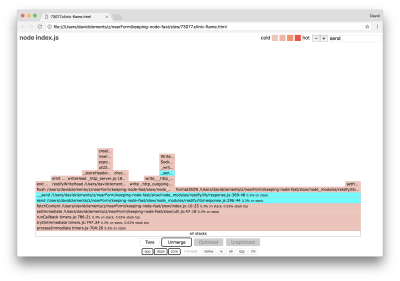
Clinic’s flame graph visualization

The width of a block represents how much time it spent on CPU overall. Three main stacks can be observed taking up the most time, all of them highlighting server.on as the hottest function. In truth, all three stacks are the same. They diverge because during profiling optimized and unoptimized functions are treated as separate call frames. Functions prefixed with a * are optimized by the JavaScript engine, and those prefixed with a ~ are unoptimized. If the optimized state isn’t important to us, we can simplify the graph further by pressing the Merge button. This should lead to view similar to the following:

Merged flame graph

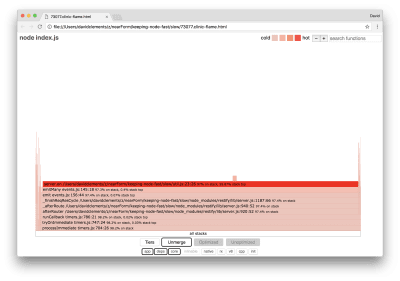
Merging the flame graph

From the outset, we can infer that the offending code is in the util.js file of the application code.

The slow function is also an event handler: the functions leading up to the function are part of the core events module, and server.on is a fallback name for an anonymous function provided as an event handling function. We can also see that this code isn’t in the same tick as code that actually handles the request. If there were functions in the core, http, net, and stream would be in the stack.

Such core functions can be found by expanding other, much smaller, parts of the flame graph. For instance, try using the search input on the top right of the UI to search for send (the name of both restify and http internal methods). It should be on the right of the graph (functions are alphabetically sorted):

Flame graph has two small blocks highlighted which represent HTTP processing function

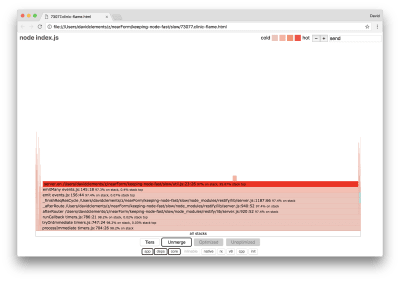
Searching the flame graph for HTTP processing functions

Notice how comparatively small all the actual HTTP handling blocks are.

We can click one of the blocks highlighted in cyan which will expand to show functions like writeHead and write in the http_outgoing.js file (part of Node core http library):

Flame graph has zoomed into a different view showing HTTP related stacks

Expanding the flame graph into HTTP relevant stacks

We can click all stacks to return to the main view.

The key point here is that even though the server.on function isn’t in the same tick as the actual request handling code, it’s still affecting the overall server performance by delaying the execution of otherwise performant code.

Debugging

We know from the flame graph that the problematic function is the event handler passed to server.on in the util.js file.

Let’s take a look:

server.on(‘after’, (req, res) => {
if (res.statusCode !== 200) return
if (!res._body) return
const key = crypto.createHash(‘sha512’)
.update(req.url)
.digest()
.toString(‘hex’)
const etag = crypto.createHash(‘sha512’)
.update(JSON.stringify(res._body))
.digest()
.toString(‘hex’)
if (cache[key] !== etag) cache[key] = etag
})

It’s well known that cryptography tends to be expensive, as does serialization (JSON.stringify) but why don’t they appear in the flame graph? These operations are in the captured samples, but they’re hidden behind the cpp filter. If we press the cpp button we should see something like the following:

Additional blocks related to C++ have been revealed in the flame graph (main view)

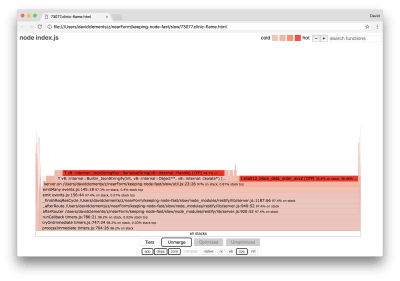
Revealing serialization and cryptography C++ frames

The internal V8 instructions relating to both serialization and cryptography are now shown as the hottest stacks and as taking up most of the time. The JSON.stringify method directly calls C++ code; this is why we don’t see a JavaScript function. In the cryptography case, functions like createHash and update are in the data, but they are either inlined (which means they disappear in the merged view) or too small to render.

Once we start to reason about the code in the etagger function it can quickly become apparent that it’s poorly designed. Why are we taking the server instance from the function context? There’s a lot of hashing going on, is all of that necessary? There’s also no If-None-Match header support in the implementation which would mitigate some of the load in some real-world scenarios because clients would only make a head request to determine freshness.

Let’s ignore all of these points for the moment and validate the finding that the actual work being performed in server.on is indeed the bottleneck. This can be achieved by setting the server.on code to an empty function and generating a new flamegraph.

Alter the etagger function to the following:

function etagger () {
var cache = {}
var afterEventAttached = false
function attachAfterEvent (server) {
if (attachAfterEvent === true) return
afterEventAttached = true
server.on(‘after’, (req, res) => {})
}
return function (req, res, next) {
attachAfterEvent(this)
const key = crypto.createHash(‘sha512’)
.update(req.url)
.digest()
.toString(‘hex’)
if (key in cache) res.set(‘Etag’, cache[key])
res.set(‘Cache-Control’, ‘public, max-age=120’)
next()
}
}

The event listener function passed to server.on is now a no-op.

Let’s run clinic flame again:

clinic flame –on-port=’autocannon -c100 localhost:$PORT/seed/v1′ — node index.js

This should produce a flame graph similar to the following:

Flame graph shows that Node.js event system stacks are still the bottleneck

Flame graph of the server when server.on is an empty function

This looks better, and we should have noticed an increase in request per second. But why is the event emitting code so hot? We would expect at this point for the HTTP processing code to take up the majority of CPU time, there’s nothing executing at all in the server.on event.

This type of bottleneck is caused by a function being executed more than it should be.

The following suspicious code at the top of util.js may be a clue:

require(‘events’).defaultMaxListeners = Infinity

Let’s remove this line and start our process with the –trace-warnings flag:

node –trace-warnings index.js

If we profile with AutoCannon in another terminal, like so:

autocannon -c100 localhost:3000/seed/v1

Our process will output something similar to:

(node:96371) MaxListenersExceededWarning: Possible EventEmitter memory leak detected. 11 after listeners added. Use emitter.setMaxListeners() to increase limit
at _addListener (events.js:280:19)
at Server.addListener (events.js:297:10)
at attachAfterEvent
(/Users/davidclements/z/nearForm/keeping-node-fast/slow/util.js:22:14)
at Server.
(/Users/davidclements/z/nearForm/keeping-node-fast/slow/util.js:25:7)
at call
(/Users/davidclements/z/nearForm/keeping-node-fast/slow/node_modules/restify/lib/chain.js:164:9)
at next
(/Users/davidclements/z/nearForm/keeping-node-fast/slow/node_modules/restify/lib/chain.js:120:9)
at Chain.run
(/Users/davidclements/z/nearForm/keeping-node-fast/slow/node_modules/restify/lib/chain.js:123:5)
at Server._runUse
(/Users/davidclements/z/nearForm/keeping-node-fast/slow/node_modules/restify/lib/server.js:976:19)
at Server._runRoute
(/Users/davidclements/z/nearForm/keeping-node-fast/slow/node_modules/restify/lib/server.js:918:10)
at Server._afterPre
(/Users/davidclements/z/nearForm/keeping-node-fast/slow/node_modules/restify/lib/server.js:888:10)

Node is telling us that lots of events are being attached to the server object. This is strange because there’s a boolean that checks if the event has been attached and then returns early essentially making attachAfterEvent a no-op after the first event is attached.

Let’s take a look at the attachAfterEvent function:

var afterEventAttached = false
function attachAfterEvent (server) {
if (attachAfterEvent === true) return
afterEventAttached = true
server.on(‘after’, (req, res) => {})
}

The conditional check is wrong! It checks whether attachAfterEvent is true instead of afterEventAttached. This means a new event is being attached to the server instance on every request, and then all prior attached events are being fired after each request. Whoops!

Optimizing

Now that we’ve discovered the problem areas, let’s see if we can make the server faster.

Low-Hanging Fruit

Let’s put the server.on listener code back (instead of an empty function) and use the correct boolean name in the conditional check. Our etagger function looks as follows:

function etagger () {
var cache = {}
var afterEventAttached = false
function attachAfterEvent (server) {
if (afterEventAttached === true) return
afterEventAttached = true
server.on(‘after’, (req, res) => {
if (res.statusCode !== 200) return
if (!res._body) return
const key = crypto.createHash(‘sha512’)
.update(req.url)
.digest()
.toString(‘hex’)
const etag = crypto.createHash(‘sha512’)
.update(JSON.stringify(res._body))
.digest()
.toString(‘hex’)
if (cache[key] !== etag) cache[key] = etag
})
}
return function (req, res, next) {
attachAfterEvent(this)
const key = crypto.createHash(‘sha512’)
.update(req.url)
.digest()
.toString(‘hex’)
if (key in cache) res.set(‘Etag’, cache[key])
res.set(‘Cache-Control’, ‘public, max-age=120’)
next()
}
}

Now we check our fix by profiling again. Start the server in one terminal:

node index.js

Then profile with AutoCannon:

autocannon -c100 localhost:3000/seed/v1

We should see results somewhere in the range of a 200 times improvement (Running 10s test @ http://localhost:3000/seed/v1 — 100 connections):

Stat
Avg
Stdev
Max

Latency (ms)
19.47
4.29
103

Req/Sec
5011.11
506.2
5487

Bytes/Sec
51.8 MB
5.45 MB
58.72 MB

50k requests in 10s, 519.64 MB read

It’s important to balance potential server cost reductions with development costs. We need to define, in our own situational contexts, how far we need to go in optimizing a project. Otherwise, it can be all too easy to put 80% of the effort into 20% of the speed enhancements. Do the constraints of the project justify this?

In some scenarios, it could be appropriate to achieve a 200 times improvement with a low hanging fruit and call it a day. In others, we may want to make our implementation as fast as it can possibly be. It really depends on project priorities.

One way to control resource spend is to set a goal. For instance, 10 times improvement, or 4000 requests per second. Basing this on business needs makes the most sense. For instance, if server costs are 100% over budget, we can set a goal of 2x improvement.

Is your pattern library up to date today? Alla Kholmatova has just finished a fully fledged book on Design Systems and how to get them right. With common traps, gotchas and the lessons she learned. Hardcover, eBook. Just sayin’.

Table of Contents →

Taking It Further

If we produce a new flame graph of our server, we should see something similar to the following:

Flame graph still shows server.on as the bottleneck, but a smaller bottleneck

Flame graph after the performance bug fix has been made

The event listener is still the bottleneck, it’s still taking up one-third of CPU time during profiling (the width is about one third the whole graph).

What additional gains can be made, and are the changes (along with their associated disruption) worth making?

With an optimized implementation, which is nonetheless slightly more constrained, the following performance characteristics can be achieved (Running 10s test @ http://localhost:3000/seed/v1 — 10 connections):

Stat
Avg
Stdev
Max

Latency (ms)
0.64
0.86
17

Req/Sec
8330.91
757.63
8991

Bytes/Sec
84.17 MB
7.64 MB
92.27 MB

92k requests in 11s, 937.22 MB read

While a 1.6x improvement is significant, it arguable depends on the situation whether the effort, changes, and code disruption necessary to create this improvement are justified. Especially when compared to the 200x improvement on the original implementation with a single bug fix.

To achieve this improvement, the same iterative technique of profile, generate flamegraph, analyze, debug, and optimize was used to arrive at the final optimized server, the code for which can be found here.

The final changes to reach 8000 req/s were:

Don’t build objects and then serialize, build a string of JSON directly;
Use something unique about the content to define it’s Etag, rather than creating a hash;
Don’t hash the URL, use it directly as the key.

These changes are slightly more involved, a little more disruptive to the code base, and leave the etagger middleware a little less flexible because it puts the burden on the route to provide the Etag value. But it achieves an extra 3000 requests per second on the profiling machine.

Let’s take a look at a flame graph for these final improvements:

Flame graph shows that internal code related to the net module is now the bottleneck

Healthy flame graph after all performance improvements

The hottest part of the flame graph is part of Node core, in the net module. This is ideal.

Preventing Performance Problems

To round off, here are some suggestions on ways to prevent performance issues in before they are deployed.

Using performance tools as informal checkpoints during development can filter out performance bugs before they make it into production. Making AutoCannon and Clinic (or equivalents) part of everyday development tooling is recommended.

When buying into a framework, find out what it’s policy on performance is. If the framework does not prioritize performance, then it’s important to check whether that aligns with infrastructural practices and business goals. For instance, Restify has clearly (since the release of version 7) invested in enhancing the library’s performance. However, if low cost and high speed is an absolute priority, consider Fastify which has been measured as 17% faster by a Restify contributor.

Watch out for other widely impacting library choices — especially consider logging. As developers fix issues, they may decide to add additional log output to help debug related problems in the future. If an unperformant logger is used, this can strangle performance over time after the fashion of the boiling frog fable. The pino logger is the fastest newline delimited JSON logger available for Node.js.

Finally, always remember that the Event Loop is a shared resource. A Node.js server is ultimately constrained by the slowest logic in the hottest path.

Smashing Editorial
(rb, ra, il)

The best VPN for Mac and Windows in 2018

Original Source: http://feedproxy.google.com/~r/CreativeBloq/~3/_a5IKv_V09U/best-vpn-deals-for-mac-and-windows

Struggling to know which is the best VPN service for your needs? We can help: we’ve taken a look at all the major Virtual Private Networks and rated the best VPNs below, to help you choose which is right for you.

The best web hosting services of 2018

Whether you’re working from Beijing and need the best VPN for China, or you’re based in your local coffee shop and need better security, we’ve got the best VPN for creative professionals – as well as the best VPN deals – right here.

And don’t worry: you don’t have to be technical. VPNs are surprisingly simple. Some just take minutes to get up and running… 

What is a VPN and why do I need it?

VPN, which stands for virtual private network, is a service that encrypts your internet communications. It enables users to securely access a private network, and send and receive data remotely.

If you’re a freelancer, for example, a VPN lets you remotely connect to an office network as though you were working in the building. It’ll also let you securely send confidential material to a client or do your banking from an unsecured public network, such as a coffee shop Wi-Fi spot, or abroad.

A VPN can also keep your internet browsing anonymous, or make you appear to be located in another country – which can be useful if you work with global clients that have IP-based restrictions on their sites. “I often have to fire up the VPN to make myself appear as if I’m in different EU territories,” says London-based web designer Robert Fenech. “A quick 'turn on and select country', and voila.”

Sometimes it’s not the website protocols themselves that you have to get round, but government censorship. Just imagine you’re visiting Beijing and needed to download some Photoshop files from a service that the ‘Great Firewall of China’ has blocked. A VPN can help you get around that too.

Whatever your reasons for using a VPN, there are a number of services on the market. Here, we’ve picked the very best VPNs for designers, artists and creatives. 

The best VPN services and deals in 2018

Canadian VPN service TunnelBear is aimed squarely at non-technies and VPN newbies. It’s incredibly easy to use, and gives you a wide range of clients – covering both desktop and mobile devices.  Setting up the TunnelBear VPN takes a matter of minutes, with a hugely simplified process compared to other VPN services. Explanations are jargon-free and written in the kind of plain English everyone can understand. 

The flipside of that, of course, is that options are limited compared to other VPNs, so more advanced users looking for high levels of configuration will be better off with a rival service. But that aside, what TunnelBear does, it does very well, with the choice of more than 20 servers around the globe, and pretty impressive speeds overall (although those speeds do drop a little over long-distance connections).

Paid plans give you unlimited data and can be had for a reasonable $4.16 per month. And TunnelBear also offers a free VPN service, which limits you to just 500MB of traffic per month.

Best VPN: Cyber Ghost

 CyberGhost is the best VPN for you if you're looking for a service that's a bit more customisable than TunnelBear (above) – yet feel a little intimidated by jargon and over-complex instructions. It's headquartered in Romania, and has a ton of easy-to-follow guides that explain everything in basic English that anyone can follow.

These are handily divided up by device, so you don’t have to cross-reference all over the place. And they explain everything from how to surf anonymously and how to block ads to more advanced fare, such as how to configure a Raspberry Pi as a web proxy with OpenVPN, or how to share a VPN connection over Ethernet.

And it’s good that these guides exist, because Cyber Ghost does offer a large number of configuration options, such as setting it to automatically run on Windows startup, assigning specific actions for different Wi-Fi networks, and making CyberGhost automatically run when you use certain apps, such as Facebook. 

The interface is pretty easy to use too. The main window offers six simple options: Surf Anonymously, Unblock Streaming, Protect Network, Torrent Anonymously, Unblock Basic Websites, and Choose My Server. And you can try the service out before you buy with the free plan – although it has some restrictions: you can only connect one device at a time, it may run slower than the full commercial service, and it displays adverts.

All in all, Cyber Ghost is a great VPN service for anyone who’s not a total newbie and wants to push what their VPN is capable off, but doesn’t want to go wading too deep into the techie weeds. 

Best VPN: VYPR VPN

VYPR VPN is a fast, highly secure service without third parties. If you’re looking for privacy, then a service based in Switzerland – known throughout history for obsessive levels of discretion within its banking system – has to be a good start. But while Vypr is keen to trumpet its service’s ability to provide privacy and security, it’s really the speed of the thing that’s the most impressive. 

VYPR VPN is hardly alone in claiming to offer “the world’s most powerful VPN”. However, it backs up this claim on the basis that, unlike many of its rivals, it owns its own hardware and runs its network. Either way, it was pretty nifty when we took it for spin. In short, if your work involves uploading and downloading a lot of hefty files, and shaving time off that is going to make a difference to your quality of life, VYPR VPN is the one of the best VPNs you can choose. 

Best VPN: Windscribe

Windscribe offers a decent enough VPN that has one main benefit over rivals: its commercial plan allows for unlimited connections. That means that you can use it on as many devices as you want simultaneously, where most providers only offer five. 

Alternatively, you might be attracted by the high-level of privacy it offers. You don’t have to use your real name or provide an email address to sign up to the service. And if you want to stay totally anonymous you can (as with most VPNs) you can pay with Bitcoin. Plus, being based in Canada, it’s nicely out of reach of US law enforcement agents.

If neither of those things are a big selling point, though, then it probably shouldn’t be your first choice, as performance and features as a whole are fairly average. Prices start at $3.70 a month for a biannual plan.

Best VPN: HotSpot shield

HotSpot shield offers an impressive level of speed

HotSpot Shield is another fast mover. When we took it for a spin, we experienced very fast upload and download speeds when transferring big image files, and while these weren’t quite up to Vypr’s levels, they were pretty darned close. 

This may not be the best choice if privacy is your biggest priority, though. HotSpot Shield is based in California, making it subject to U.S law enforcement. It doesn’t let you pay for the service with Bitcoin. And it uses its own proprietary VPN protocol, which some people are suspicious of because it hasn’t been widely analysed externally. 

That said, Hotspot Shield Premium's high speeds and low prices have clear appeal, and the seven-day trial makes it easy to test the service for yourself. As you'd expect, the best value for money is the one-year subscription, unless you want to commit to the lifetime plan. 

Best VPN: ExpressVPN

ExpressVPN has a hard-won reputation for excellent customer service

ExpressVPN is based in the British Virgin Islands, which may ring alarm bells for privacy enthusiasts. But there’s no need to worry: this self-governing tax haven is in no way interfered with by British law enforcement. As you’d hope from the name, it’s also a super-fast VPN service and offers high levels of encryption. On the downside, it only offers three simultaneous connections per user, where most services offer five.

But what really stands out for ExpressVPN is its customer support. Although it’s not alone in offering live chat, 365 days a year, 24 hours a day, its agents have a great reputation for sorting problems quickly, efficiently and with a smile in their voice. And while that’s not often our main consideration when selecting a provider of any service, perhaps it should be.

Related articles:

The expert guide to working from homeThe essential guide to tools for designers10 top prototyping tools

Move the World Mural Drawings by Deck Two

Original Source: http://feedproxy.google.com/~r/abduzeedo/~3/atJW2Zx6Duw/move-world-mural-drawings-deck-two

Move the World Mural Drawings by Deck Two

Move the World Mural Drawings by Deck Two

AoiroStudio
Jun 08, 2018

Very cool project title for a mural drawing by Deck two who is an artist from Paris, France. Entitled: Move the World, we follow him on this absolute beautiful drawing showcasing the important landmarks of the World. It’s quite stunning and I can’t even imagine the level of patience it would take to work on this kind of project. Props to Thomas for his incredible dedication!

One of my last mural project in Memphis, Tennessee. A huge 2,6 x 13 meters long panoramic view in the entrance of JKI offices. That mural embraces all the famous places in the world that the company has been reaching through the years. Long days of work to complete this freehand mural with just a couple of Molotow acrylic markers. I chose a small 2mm nib to get as much details as I could so the visitors could stare at the walls to discover all the hidden details. I hope you guys will like it too.

More Links
Learn about about Deck two
Follow Deck two’s work on Behance
Illustration & Art Direction
Move the World Mural Drawings by Deck TwoMove the World Mural Drawings by Deck TwoMove the World Mural Drawings by Deck TwoMove the World Mural Drawings by Deck TwoMove the World Mural Drawings by Deck TwoMove the World Mural Drawings by Deck TwoMove the World Mural Drawings by Deck TwoMove the World Mural Drawings by Deck TwoMove the World Mural Drawings by Deck TwoMove the World Mural Drawings by Deck TwoMove the World Mural Drawings by Deck Two

mural
murals
drawing
drawings